15 Case Studies
The following case studies have been compiled from 2020 to 2025. Each case study has a date in the title indicating when it was added to this section. The case studies are provided for illustrative purposes and general reference. They demonstrate examples of methods and results from selected sites that may be applicable at other locations, depending on site specific conditions. The information is provided for general reference. Please see the ITRC disclaimer.
| Section Number | Topic |
|---|---|
| 15.1 | Site Characterization Case Studies |
| 15.2 | Treatment Case Studies |
| 15.3 | Risk Assessment Case Study |
| 15.4 | Risk Communication Case Studies |
| 15.5 | Surface Water Quality Case Studies |
The PFAS team has identified and included case studies supporting the following sections:
- Section 10 Site Characterization
- Section 12 Treatment Technologies
- Section 9 Risk Assessment
- Section 14 Risk Communication
- Section 16 Surface Water Quality
15.1 Site Characterization Case Studies
15.1.1 Data Visualization at an AFFF Release Site (2020)
McGuire et al. (2014) and McGuire (2013) presented a detailed characterization of a subset of PFAS soil and groundwater concentrations, focused on PFAAs in the vicinity of a former unlined burn pit where fire training activities were conducted up to 1990. Data presented in McGuire et al. (2014) were used for this visualization example. For brevity, this example shows relative concentration trends between shallow and deep soil samples collected at six borings where total PFAA concentrations exceeded 5,000 ug/Kg in shallow soil. The inset map in the top left of Figure 15-1 shows the former burn pit location, as well as the locations of these six borings (S-2, S-4, S-5, S-6, S-7, and S-10). Shallow soil samples were collected at a depth of approximately 2 ft below ground surface (ft bgs) (0.61 m), and the deep soil samples were collected at the water table, which is approximately 15–20 ft bgs (4.6–6.1 m) on average.
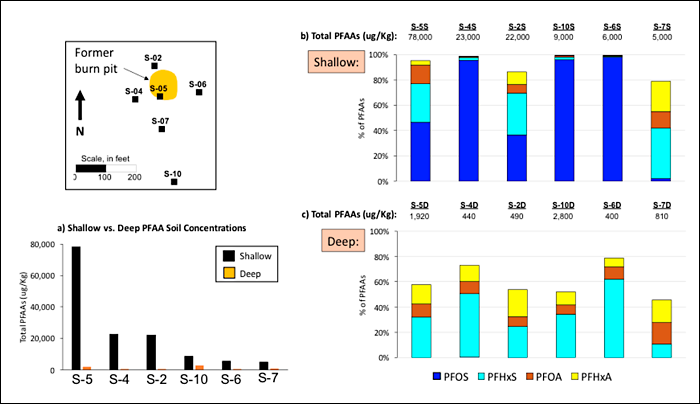
Figure 15-1. Comparison of shallow and deep soil samples at an AFFF release site.
Source: G. Carey, Porewater Solutions. Used with permission.
The bar chart in Figure 15-1a compares concentrations of shallow and deep soil concentrations for total PFAAs at these six boreholes and clearly demonstrates that shallow PFAA soil concentrations are much higher than deeper soil concentrations at the water table. This figure indicates that there is likely attenuation that limits vertical migration of PFAAs. McGuire (2013) attributed this to the high clay content of vadose zone soils, and high VOCs and TOC in this area, which may enhance retardation.
A different type of bar chart is shown in Figure 15-1b to illustrate the composition of the main PFAA constituents in shallow soil samples (PFHxS, PFOS, PFHxA, PFOA). Review of Figure 15-1b reveals the following trends:
- In three of the six boring locations, PFOS is greater than 95% of total PFAA concentrations in shallow soil.
- In the other three borings, PFOS is less than 50% of total PFAAs. These borings have higher relative concentrations of PFHxS, PFHxA, and PFOA.
- PFHxS, PFOS, PFHxA, and PFOA combined represent at least 80% of total PFAA concentrations in shallow soil.
The difference in PFOS composition shown in Figure 15-1b suggests that some borings were drilled in an area that was influenced by a mixture of different AFFF products, whereas other borings with a high proportion of PFOS may be influenced primarily by AFFF produced using electrochemical fluorination.
Figure 15-1c shows the same type of bar chart with relative percent of total PFAA concentrations for the deeper soil samples collected at the water table. Comparison of Figures 15-1b and 15-1c indicates that there is a clear difference in PFAA composition between the shallow and deep soil samples. PFOS is very low in terms of relative concentrations in deep soil samples, compared to the shallow soil samples where PFOS makes up a higher proportion of the total PFAA concentration. This may be due to enhanced retardation of PFOS in the vadose zone relative to the other compounds (PFHxS, PFHxA, and PFOA), which is consistent with the relative site-specific Koc values determined by McGuire et al. (2014). In addition, Figure 15-1c shows that these four compounds typically represent only around 50% of total PFAA concentrations in the deep samples, which suggests that shorter chain compounds are more prevalent at the water table and in underlying groundwater, most likely due to precursor transformations.
Radial diagrams may also be used as visual aids to illustrate spatial and/or temporal trends for individual PFAS constituents or total concentrations for various PFAS groups. As an example, Figure 15-2 presents a radial diagram map showing trends for various PFSAs (PFOS, PFHxS, PFBS) as well as perfluorohexane sulfonamide FHxSA, which is a precursor to PFHxS. The radial diagram legend in the top right portion of Figure 15-2 shows that the four axes are arranged in order of FHxSA, PFOS, PFHxS, and PFBS. There are two data series shown on the radial diagram legend: (1) the blue-filled data series, which represents PFAS constituent concentrations at monitoring well location; and (2) a darker blue outline that represents maximum source concentrations at well GW13, which is situated directly adjacent to the former burn pit area. This latter data series is a reference and is the same at all monitoring well radial diagrams. Including this reference data series makes it easier to visualize changes in concentrations throughout the plume. The radial diagram legend also shows how symbols may be plotted to represent where constituents were not detected in a groundwater sample. Another option for radial diagram symbols is to indicate where concentrations are above groundwater cleanup criteria at each well location (not shown). The compound axes are logarithmic in this example, to allow for visualization of order of magnitude concentrations between wells, or between compounds at any one well location.
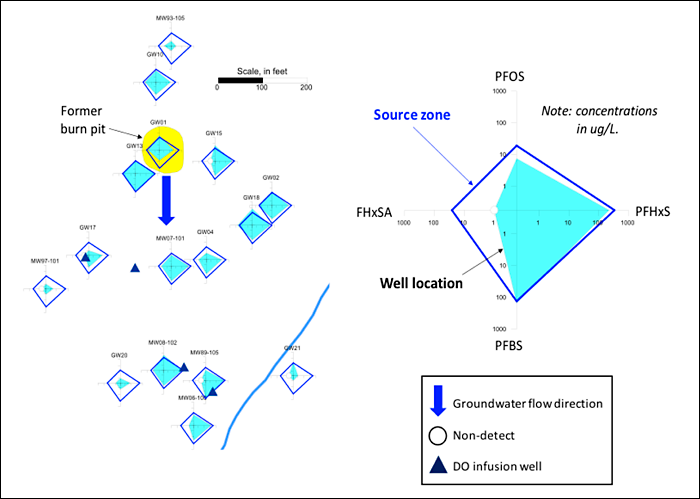
Figure 15-2. Radial diagrams illustrating PFSA trends at an AFFF release site.
Source: G. Carey, Porewater Solutions. Used with permission.
Groundwater flow in this area is generally to the south/southeast. The main radial diagram map shown in Figure 15-2 facilitates an analysis of how concentrations for these four constituents vary along the groundwater flow path downgradient from the former burn pit area, and how concentrations vary across the width of the plume. For example, the radial diagram shown at GW01, which is located inside the footprint of the former burn pit, indicates that concentrations of the longer chain compounds (FHxSA and PFOS) are similar to those in the nearby well at GW13, whereas PFHxS and PFBS are about an order of magnitude lower at GW01 then GW13. The radial diagrams also clearly show that groundwater downgradient of the DO infusion wells (triangle symbols) has low to non-detect FHxSA, indicating that aerobic transformation of this precursor has occurred downgradient of these infusion wells (Section 10.4.4).
Although not shown with this case study, radial diagrams are also helpful for visualizing redox indicator trends, to confirm whether redox conditions are favorable for the transformation of precursors to PFAAs. Examples of a modified radial diagram method used for redox zone delineation are presented in Carey et al. (1999) and Carey et al. (2003).
15.1.2 Application of Radial Diagrams (2020)
Figure 15-3 presents another type of application of radial diagrams for visualizing certain PFAS trends, in this case for an aquifer contaminated with PFAS from several fire training areas in the vicinity of Uppsala, Sweden. The blue outlines shown in Figure 15-3 represent the boundaries of eskers (deposits formed by streams flowing beneath a glacier), which essentially act to channel groundwater flow in the aquifer. The legend shown on Figure 15-3 indicates that the four axes of the radial diagram now represent concentrations of 6:2 FTS (which dominates the other FTSs), total PFCAs, total PFSAs, and total concentrations of other chemical-specific precursors. Symbols are shown to represent non-detects at each well location. Groundwater flow in the main aquifer channel is from northwest to southeast (parallel to the river channel) and is to the west in the inset box shown in the bottom center of Figure 15-3.
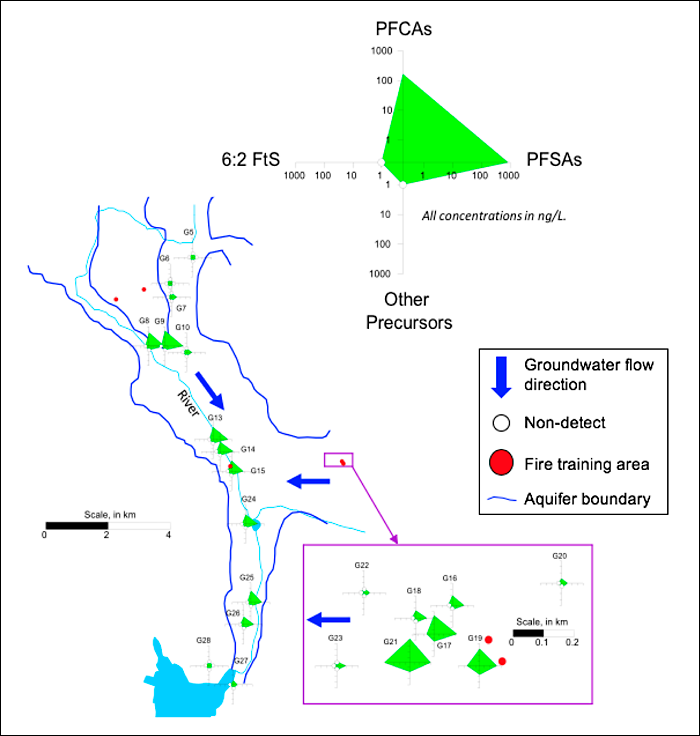
Figure 15-3. PFAS composition in groundwater.
Source: G. Carey, Porewater Solutions. Used with permission.
Examples of trends that are evident based on the radial diagram map (Figure 15-3) include:
- All chemical-specific precursors are nondetect in the main aquifer channel, indicating that precursors were effectively attenuated closer to the fire training areas.
- PFSA and PFCA concentrations appear to be declining along the main flow channel (for example, downgradient of G8 and G9.
- Concentrations of precursors in the vicinity of the fire training areas shown in the inset map are much higher than in the main groundwater flow channel. This indicates that precursors may be attenuating prior to reaching the main flow channel in this area, due to sorption, biotransformation, and/or possibly discharge to the nearby creek.
- The combination of elevated PFCAs and PFSAs, as well as high 6:2 FtS near at least two of the fire training areas, indicates that AFFFs produced using telomerization were used at one point at some of these fire training areas.
15.1.3 Application of Environmental Sequence Stratigraphy (ESS) (2023)
Due to the high mobility and persistence of PFAS, groundwater plumes may extend to greater distances than those observed for conventional contaminants such as hydrocarbons and chlorinated solvents. Consequently, PFAS plumes may be more susceptible to unusual groundwater plume flow patterns. For example, site geology may cause groundwater plumes to diverge from directions predicted based on evaluation of a groundwater potentiometric surface (hydraulic gradient). Furthermore, longer groundwater plumes experienced by PFAS may result in groundwater/surface-water interaction to a greater extent. The case study presents an example where environmental sequence stratigraphy (ESS) is used to update a conceptual site model (CSM) for a PFAS-impacted site.
ESS (USEPA 2017) is a data analysis technique designed to improve CSMs through enhanced understanding of interaction between site geology, groundwater flow patterns, and preferential contaminant transport pathways. ESS provides a framework for interpretation of data generated via high-resolution site characterization (HRSC), existing subsurface data, such as geologic boring logs, and (potentially) geophysical data. The data evaluation focuses on site depositional/erosion history to identify geologic sequences and patterns (geologic heterogeneity and anisotropy in hydraulic conductivity) that explain contaminant migration pathways. ESS is useful to identify patterns in sedimentary deposits (consolidated or unconsolidated) comprising clays, silts, sands, and gravels. ESS techniques are designed for sedimentary deposits and are not applicable to metamorphic/crystalline rock or glacial till; however, adjusted ESS techniques can also be applied to glacial outwash deposits, which have similar characteristics to nonglacial sedimentary deposits.
This case study describes a site where ESS predicted a groundwater plume that did not follow the direction expected via simple hydraulic gradient analysis.
15.1.3.1 Sequence Stratigraphy
Sequence stratigraphy involves the study of geologic heterogeneity in sedimentary deposits in the context of their depositional environments and is applicable to sites underlain by sedimentary aquifers (for example, intermixed gravels, sands, silts, and clays). Subtle geologic heterogeneities can have significant effects on groundwater and contaminant transport. The ESS framework is designed to evaluate and incorporate these heterogeneities into a CSM to improve understanding of contaminant fate and transport. ESS techniques involve three-dimensional evaluation of geologic data, with an experienced geologist looking for detailed patterns and trends in the depositional framework (for example, lateral and/or vertical continuity of geologic strata).
ESS implementation generally involves a three-step process. The first step involves review and understanding of the regional geology and depositional environment. The second step involves a detailed review of existing lithology data, to assess both vertical and horizontal grain-size sedimentary patterns. Additional information may also be incorporated at this step, such as geophysical data and/or manmade site features (for example, drainage pathways). The third step involves development of a CSM integrating the detailed geologic data collected during the preceding steps to develop a hydrostratigraphic understanding of what controls migration of groundwater and contaminants. During this third step, three-dimensional data-modeling tools may be used to interpret the lateral continuity of subsurface strata, identify trends and/or lithologic sequences, and integrate geology and geochemical data sets.
This method can identify preferential groundwater and contaminant flow pathways associated with the geology and hydrogeology that may not be apparent in conventional/engineering-focused investigations, and may not necessarily follow the general groundwater gradient. Furthermore, ESS techniques can be useful to map and predict contaminant mass transport, identify data gaps, and identify target locations for focused investigation and/or remediation.
15.1.3.2 Site Background
An updated CSM (Trihydro 2019) was prepared for Ellsworth Air Force Base, where previous training and incident response involving aqueous film-forming foam (AFFF) resulted in groundwater impacted by PFAS as documented in a PFAS site inspection report of aqueous film forming foam areas (Aerostar 2019). Historical site investigations were typically focused on specific operable units (OUs) in a piecemeal fashion. As a result, geologic and hydrogeologic connections between some OUs were not apparent. Furthermore, previous investigations focused on contaminants of concern such as trichloroethene (TCE).
A detailed evaluation of regional and site geology was conducted in accordance with the ESS framework and is summarized herein. Briefly, regional geology consists of confined and unconfined aquifers. The shallow, unconfined aquifer comprises unconsolidated sediments (terrace alluvium) overlying the Pierre Shale formation, which covers a large segment of the plains surrounding the Black Hills and is reported to be up to 860 feet thick at the site. The Pierre Shale is a low-permeability formation that functions as a barrier to vertical groundwater flow, and as a confining unit to deeper aquifers. Deeper, confined aquifers exist at depth beneath the Pierre Shale. The Pierre Shale is considered the bedrock surface at the site and is encountered between 0 and 40 feet below ground surface.
The CSM focused on the shallow aquifer, defined as a terrace alluvium, which includes a combination of paleochannel deposits, modern channel deposits, and undifferentiated sediments (see geologic cross-section shown in Figure 15-4). The undifferentiated sediments are poorly graded deposits associated with floodplains, wind, or other weathering, which are generally more fine-grained and lower permeability than the channel deposits. The paleochannel deposits consist of sand and gravel, deposited by ancient surface-water streams, with characteristics including high permeability and fining-upwards sequences. The paleochannel deposits underlying Ellsworth AFB provide preferred pathways for groundwater and contaminants with unpredictable orientations that are not discernable from the direction of modern drainages.
For the updated CSM, the site depositional history was evaluated, along with historical geologic and hydrogeologic data sets. The project involved “synthesizing decades of lithology data, from over 1,100 boreholes [within a site area of approximately 4,800 acres] with varying geologic interpretation” (Trihydro 2021). Site depositional history was evaluated and lithology logs were compiled and integrated with manmade infrastructure features to map out fine-scale geologic features and identify trends and pathways that affect contaminant migration. The large number of existing boreholes provided a rich data set for ESS evaluation, and a multimonth effort was required to review the existing logs and convert the logs into digital format,
As part of the ESS evaluation, the project team “looked at fine scale stratigraphic patterns in the contaminant transport pathways to predict where additional remedial solutions should be located” (Trihydro 2021). One of the questions posed midproject was to figure out how the shallow groundwater, outside of the base boundary, had become impacted by PFOA/PFAS. The area was approximately 0.5 miles from any known release or storage area.
15.1.3.3 Results
The CSM developed for Ellsworth AFB used ESS techniques to show how geologic heterogeneity and anisotropy, resulting from site depositional history, caused multiple PFAS groundwater plumes to diverge from the direction predicted using simple potentiometric surface maps. The ESS evaluation identified several course-grained channel structures throughout the site. “More specifically, the CSM showed how buried paleochannel structures and a subtle weathered bedrock surface controlled contaminant migration pathways” (Trihydro 2021). In addition, subsurface stormwater structures were identified as high-permeability conduits, potentially providing secondary migration pathways for contaminants off site.
As illustrated in Figure 15-5, the groundwater plume (the TCE plume is shown in yellow) diverges from the prevailing groundwater flow direction (blue arrows) after encountering a course-grained paleochannel (shown in dark pink). The TCE plume is illustrated on Figure 15-5 due to the extensive historical data set for TCE that is amenable to detailed plume mapping, better than would be the case for PFAS; the PFAS data set remains relatively limited (but growing) at the site. Detailed geologic cross-sections generated through the ESS evaluation (Figure 15-4) provide further insights into the structure of the paleochannels that influence the plume behavior. “Through ESS techniques, portions of previously unidentified plumes were found” (Trihydro 2021), and subsequent PFAS site characterization and/or remediation activities will rely on the new understanding moving forward to provide a more accurate remedial strategy.
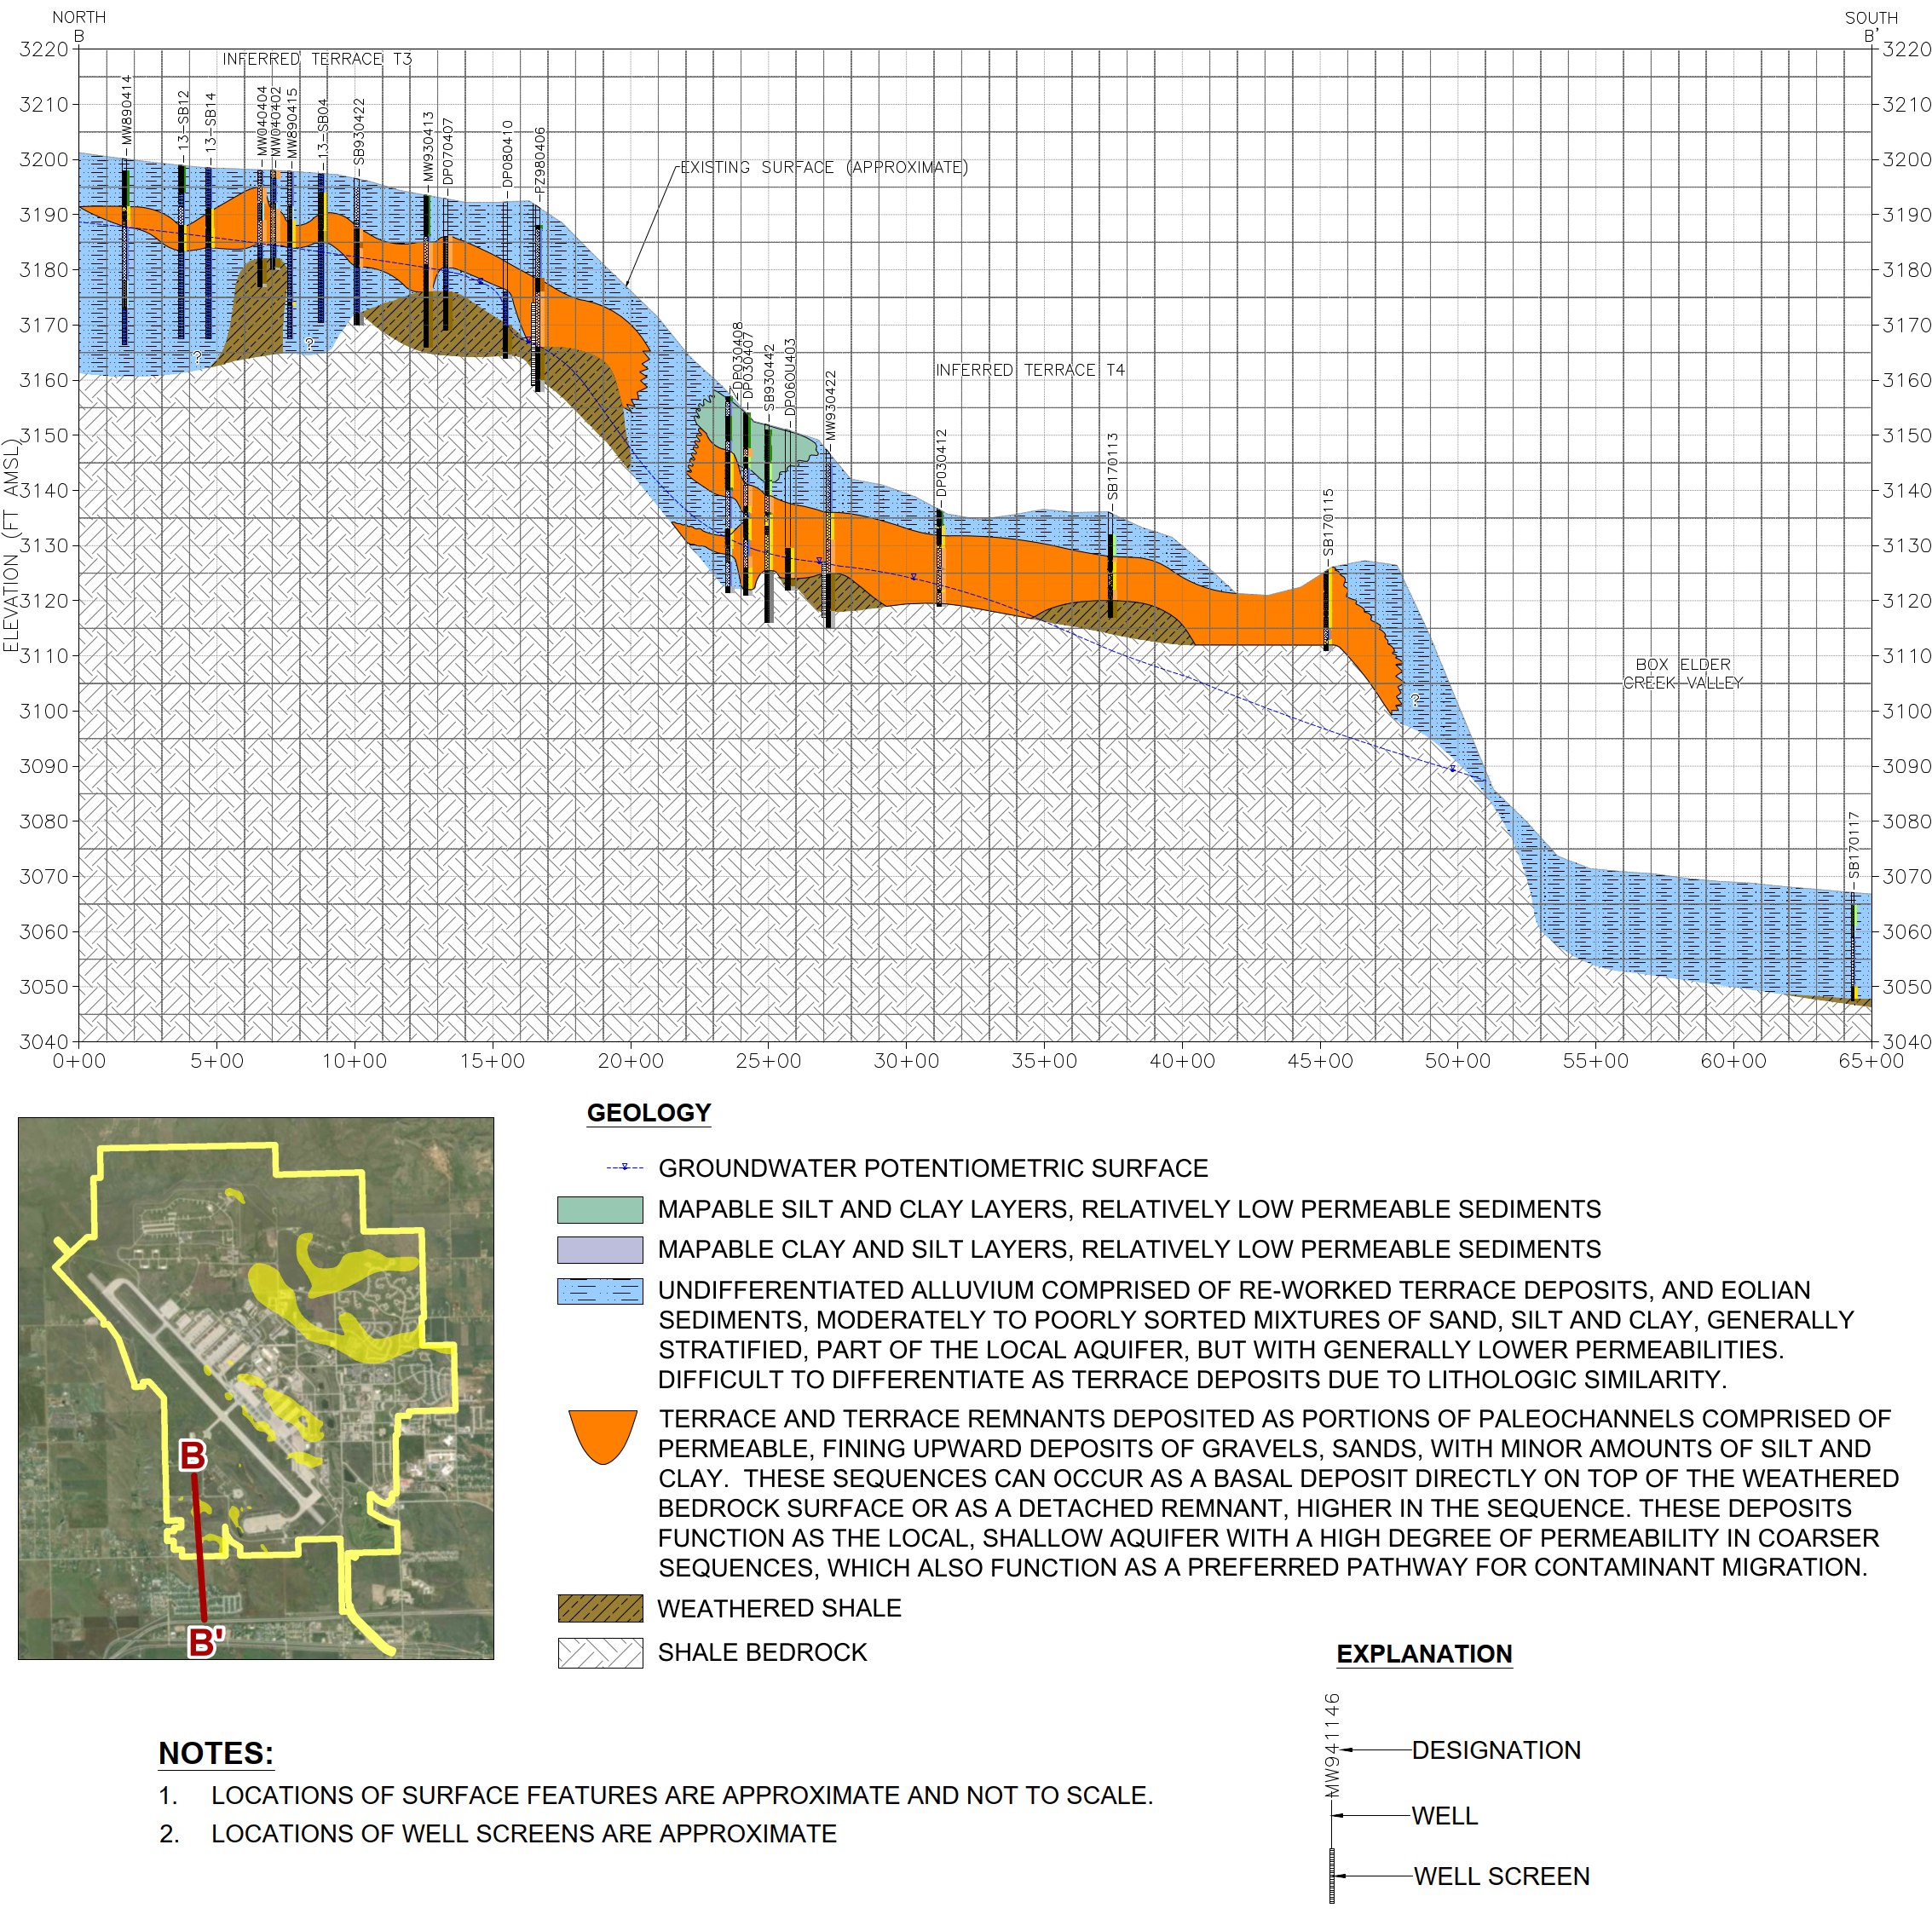
Figure 15-4. Geologic cross-section generated from ESS evaluation (Trihydro 2019).
Source: M. Olson, Trihydro. Used with permission.
Figure 15-5. Excerpt from TCE plume map (Trihydro 2019).
Source: M. Olson, Trihydro. Used with permission.
15.1.4 Case Study: PFAS in Drinking Water Aquifer from Residential Septic Systems—A Conceptual Site Model (2025)
Contributed by Jenna Raup, TRC Engineers Inc., used with permission.
Multiple lines of evidence suggest that septic systems are contributing PFAS to overburden groundwater and fractured bedrock supply wells in a densely developed residential area lacking municipal water and sewer. As part of New York State’s emerging contaminant sampling initiative, TRC Engineers Inc. (New York, NY), on behalf of the New York State Department of Environmental Conservation, sampled groundwater at a dry-cleaning State Superfund Site, and PFAS were detected above comparison criteria. The surrounding area was surveyed for sensitive receptors, and private water supply wells were tested to evaluate potential exposure. The presence of PFAS in groundwater at and near the State Superfund Site led to an investigation to determine the source(s) of PFAS in groundwater. A stepwise approach was implemented to identify potential sources via desktop review, followed by scoping and implementing targeted sampling at suspected source sites. Desktop sources reviewed included environmental reports, site and surrounding area history, environmental databases, historical documentation and maps, infrastructure construction records and maps, and numerous other publicly available records, including news reports and social media pages. Two hundred eighteen private water supply wells, which draw from the bedrock aquifer, are the domestic water source for approximately 50% of the properties within a ½-mile radius of the site (the Assessment Area). They are in locations that lack municipal water and sewer and were tested for PFAS. The results of the private well sampling were considered when searching for potential PFAS source sites.
Based on the desktop review and private water supply data, 12 potential PFAS source locations were identified for further investigation. These locations were associated with potential on-site use and release of PFAS-containing products, nearby private well sampling results indicative of a potential source, or geologic setting that represented a potential pathway to the bedrock water supply aquifer. The sampling program was designed to target potential release points, and minimize the number of samples collected. It was anticipated that concentrations of PFAS at a release point would suggest a potential source, and a subsequent remedial investigation may be warranted to define the nature and extent of the PFAS contamination. The targeted investigation program included soil or overburden groundwater sampling, or both, at each potential point source, access permitting, sediment and surface water sampling in the adjacent lake and at the discharge point of the publicly owned treatment works (POTW). In addition, the investigation program used the septic tracers, acesulfame potassium, sucralose, nitrate, and nitrite, in select bedrock water supply wells, and acesulfame potassium and sucralose in select overburden groundwater sampling locations. Though not used in this study, other common tracers such as surfactant metabolites, pharmaceuticals, antimicrobials, caffeine, boron, and others could have provided additional lines of evidence that the PFAS-rich groundwater did, in fact, co-occur with common wastewater (that is, septic) indicators. The lines of evidence presented below indicated that septic systems are the main source of PFAS in the Assessment Area bedrock water supply. Additional discussion of septic systems is included in Section 1.3.2.
- Other potential sources in the area were ruled out by the data. These included a firehouse that uses and stores aqueous film-forming foam; an oil recycling company which experienced a documented fire; a domestic septic pump out facility; boat detailing facilities; an apartment complex with on-site laundry and potential carpet cleaning; and potential sewer line inflow and exfiltration.
- PFAS concentrations in private wells were of similar order of magnitude throughout the Assessment Area. PFAS concentrations in overburden groundwater samples were of similar order of magnitude to PFAS concentrations in bedrock aquifer samples collected from private wells, and in many cases, were slightly higher.
- There is a connection between overburden and bedrock hydrogeologic units.
- Prior studies identified a downward vertical groundwater gradient in the vicinity of the Superfund site.
- Septic tracers were detected in overburden groundwater and private well–derived drinking water in every instance.
- The PFAS signatures of areawide wastewater and bedrock water supply closely match, with few exceptions.
- Approximately 50% of the Assessment Area is served by municipal water and sanitary sewers. The effluent at the POTW that receives sanitary wastewater from approximately 50% of the Assessment Area was sampled, and the PFAS signature was used as a proxy for wastewater discharges in the area. There are clear similarities among the PFAS signatures of the POTW effluent, the bedrock water supply, and overburden groundwater (relative PFAS ratios included approximately 30%–40% perfluorooctanoic acid (PFOA) and 30%–40% perfluorooctane sulfonic acid (PFOS)), followed in lesser concentrations primarily by perfluorobutane sulfonate (PFBS) and perfluoroheptanoic acid (PFHpA). Table 15-1-1 presents a statistical summary of PFAS analytical results for private wells in two discrete neighborhoods of the Assessment Area and for the POTW effluent.
- PFAS signatures in groundwater throughout the Assessment Area exhibited low variability (Table 15-1-1). In addition, in locations where both overburden groundwater and private water supply samples were analyzed, PFAS signatures matched (same predominant, secondary, tertiary PFAS).
Table 15-1-1. Statistical summary: PFAS analytical results
Source: Raup et al. 2024, https://onlinelibrary.wiley.com/doi/10.1002/rem.70001. Used with permission.
| Composite Private Well Results for 91 Homes | Composite Private Well Results for 23 Homes | POTW Discharge Effluent | |||
|---|---|---|---|---|---|
| Average | SDσ | Average | SDσ | Grab Sample Result | |
| Total PFAS (ppt) | 58.5 | 22.84 | 49.4 | 11.6 | 44.7 |
| % PFOA | 38.5 | 6.6 | 34.6 | 2.6 | 35.8 |
| % PFOS | 34.9 | 8.1 | 32.5 | 2.7 | 29.1 |
| % PFBS | 10.7 | 6.3 | 16.6 | 4.5 | 14.8 |
| % PFHpA | 10.1 | 2.7 | 9.7 | 1.1 | 9.4 |
| % PFHxS | 4.5 | 2.3 | 6.3 | 2.2 | 5.1 |
| % PFNA | 1.3 | 1.8 | 0.4 | 1.2 | 5.8 |
SDσ=standard deviation
The use of forensics and PFAS signature analysis was relatively limited due to the suite of PFAS reported for drinking water samples (6 PFAS) and the limited scope of environmental investigation (absence of upgradient, downgradient, and bedrock monitoring wells). However, based on multiple lines of evidence, the data did not substantiate the need for further investigation into any of the suspected sources. Taken together, the findings above support the following conceptual site model: consumer product use and discharge to domestic septic systems in a densely developed residential area have resulted in widespread presence of PFAS in shallow bedrock groundwater. Figure 15-1-6 depicts this using pie charts to represent PFAS in domestic products, wastewater, and overburden and bedrock groundwater. More information about data visualization is included in Section 1.3.7. Downward vertical groundwater gradients in the area and long-term supply well pumping have contributed to these impacts. It was concluded that the source of areawide PFAS impacts was unrelated to historic dry-cleaning operations at the site. A full case study is provided in Raup, J., M. Eberle, E. Denly, D. Glass, S. Stefansky, J. Dyber, B. Scharf, S. Saucier. 2024. “A Conceptual Site Model for Per- and Polyfluoroalkyl Substances Water Supply Impacts in a Residential Community.” Remediation Journal 35:e70001.
Figure 15-1-6. Conceptual site model
Source: Raup et al 2024 https://onlinelibrary.wiley.com/doi/10.1002/rem.70001. Used with permission.
15.2 Treatment Case Studies
Several well-developed technology case studies are presented in the following sections. Additional information on other water treatment case studies is summarized in Table 15-1 provided as a separate Excel file.
15.2.1 Granular Activated Carbon (GAC) (2020)
Case Study: Granular Activated Carbon System—Oakdale, Minnesota (Contributed by Virginia Yingling, Minnesota Department of Health, used with permission)
Background
Oakdale is a suburban community located east of St. Paul, Minnesota, with a population of approximately 28,000. Prior to state or federal laws regulating such waste disposal, industrial wastes from a PFAS manufacturer were disposed of in a privately operated 55-acre unlined dumpsite (Oakdale Disposal Site, 1940–1960) and in the Washington County Landfill, a permitted 40-acre unlined municipal landfill in Lake Elmo, Minnesota (1969–1975). In 2005, PFAS were detected in six of the eight operating Oakdale city drinking water supply wells.
Eight PFAS have been detected in groundwater associated with these sites, with PFBA, PFHxS, PFOA, and PFOS being present at the highest concentrations. PFAS have also contaminated a stream that drains the wetlands that comprise part of the Oakdale Disposal Site and PFAS re-infiltration has contributed to groundwater contamination in areas not immediately downgradient of the waste disposal sites. Both sites underwent remedial activities in the 1980 to address industrial solvents and in 2009–2011 to address PFAS. These actions included soil and waste excavation with on- and off-site encapsulation, and groundwater pump and treat (GAC) for hydraulic containment.
The regional groundwater flow direction at both sites is to the south-southwest toward the Mississippi River, approximately 8 miles away. The primary source for PFAS impacts to groundwater appears to be the Oakdale Disposal Site, but the Washington County Landfill may have contributed to the contamination in the easternmost city wells.
Water Characteristics
The maximum concentrations detected to date in the city wells are shown in Table 15-2 along with the relevant Minnesota health-based guidance values for PFAS in drinking water.
Table 15-2. Maximum concentrations of PFAS in drinking water from Oakdale city wells.
| Chemical | Maximum Concentration Detected in Any Oakdale City Well (µg/L) | Minnesota Department of Health’s Health-Based Guidance Value (µg/L) |
|---|---|---|
| PFBA | 2.15 | 7 |
| PFBS | 0.136 | 3 (acute), 2 (chronic, subchronic) |
| PFPeA | 0.176 | None established |
| PFHxA | 0.382 | None established |
| PFHxS | 0.142 | 0.047 |
| PFOA | 0.871 | 0.035 |
| PFOS | 1.38 | 0.015 |
| NOTE: All concentrations reported as of August 2019 and guidance values reported are as of December 2019. | ||
The Minnesota Pollution Control Agency (MPCA), Minnesota Department of Health (MDH), City of Oakdale, and the chemical manufacturer agreed to address the situation by constructing a GAC treatment plant to treat the water from the two most highly contaminated wells. In addition, the city shut off one well and drilled a replacement well north of the contaminated area. Other wells with PFAS detections are used seasonally and to maintain pressure throughout the distribution system, but the pumping schedule is managed to ensure PFAS remain below MDH guidance values in the water delivered to the community. This includes meeting the MDH’s Health Risk Index, which is a toxic equivalency quotient (TEQ)-like assessment of the additive toxicity of multiple PFAS.
Treatment Technology Design Details
The GAC treatment facility (Figure 15-6) began operations in October 2006. It consists of ten filter vessels (each containing 20,000 lbs. of GAC) set up in five parallel lead-lag pairs (shown below) housed in a 7,000 ft2 facility. The system treats 2,500 gallons per minute with a minimum empty bed contact time (EBCT) of 10 minutes per vessel. The water is combined back into one stream, chlorinated and fluoridated to meet state and federal standards, and then piped to the distribution system.
Figure 15-6. GAC treatment system, Oakdale, MN.
Source: Courtesy of the Minnesota Department of Health.
System Performance
The city and MDH monitor the PFAS concentrations in the influent, lead vessel effluent (that is, between vessels), and post–treatment facility effluent (Figures 15-7 and 15-8). Monitoring currently occurs quarterly for the first three quarters following GAC change-out and monthly in the final quarter prior to change-out.
The GAC is changed out approximately every 12 months to prevent breakthrough of any PFAS above MDH guidance values. GAC change-out may involve a complete replacement of all GAC or just the lead vessel GAC and change of flow to make the former lag vessel the new lead vessel. This will depend on the effluent concentrations at the time of change-out. Initial removal rates are 100% (below analytical limit of detection) for all seven PFAS analyzed (PFBA, PFPeA, PFHxA, PFOA, PFBS, PFHxS, PFOS).
Breakthrough order follows the expected sequence of shorter chain and PFCAs preceding longer chain and PFSAs. PFBA breakthrough of the full system typically occurs within 2 months after a complete GAC replacement, but because the influent PFBA does not exceed its health-based guidance value of 7 µg/L, this does not pose a health risk and does not trigger any response actions. Interestingly, PFBA effluent concentrations eventually exceed influent concentrations, presumably due to PFBA desorbing in the presence of more readily sorbed, longer chain PFAS. As shown in the graphs below, PFOS has broken through the full system only once (2012; max effluent concentration = 0.019 µg/L) and PFOA has broken through only four times (2010, 2012, 2015, 2018; max effluent concentration = 0.086 µg/L). At no time did any PFAS exceed the then-current health-based guidance values.
Figure 15-7. Influent and effluent concentrations for PFOS.
Source: Courtesy of the Minnesota Department of Health.
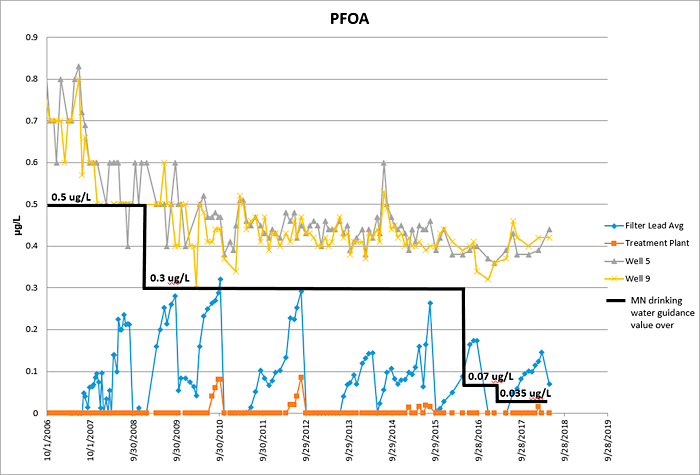
Figure 15-8. Influent and effluent concentrations for PFOA.
Source: Courtesy of the Minnesota Department of Health.
Costs
Capital costs for the GAC treatment facility were approximately $2.5 million. Annual operation and maintenance (O&M) costs, including sampling and GAC change-out, are approximately $250,000.
15.2.2 Ion Exchange (IX) Resins
Ion exchange resins can be utilized as single-use, where the media is disposed when it has reached the limit of its sorptive capacity, or regenerable, where the resin is regenerated and reused indefinitely (theoretically). The following two case studies outline field applications for these two related technologies.
15.2.2.1 Single-Use IX (2020)
Case Study: Horsham Township, Pennsylvania (Contributed by Francis Boodoo, Purolite Corporation, used with permission)
Background
The township of Horsham, Pennsylvania, located close to an AFFF release site, supplies drinking water to 7,800 residential, commercial, and industrial customers using 15 deep water wells. In 2014, five of the wells were confirmed to be impacted with PFAS. PFOS and PFOA were found in two wells at concentrations approaching the USEPA 2009 provisional health advisories (HAs) of 200 ppt and 400 ppt, respectively. These wells were immediately taken out of service. In June 2016, one month after EPA issued final HAs of 70 ppt for the combined concentrations of PFOS and PFOA, three more wells were removed from service due to elevated concentrations. The township began purchasing supplemental water from a nearby water supplier and began installing GAC filters to remediate and return the five impacted wells to service. Responding to consumer concerns, the township adopted an aggressive removal plan to reduce average PFOS/PFOA concentrations to less than 1 ppt (essentially to nondetect levels) in its entire water system by the end of 2016.
In addition to GAC filtration, the township started up a 50-gallon-per-minute selective ion exchange (IX) resin pilot in November 2016 on Well 10 to evaluate the performance of the resin in consistently reducing PFOS/PFOA to nondetect levels. A temporary 1-year permit was obtained from Pennsylvania Department of Environmental Protection (PA DEP) to install the resin pilot downstream of an existing GAC pilot that had been started up 20 days earlier. This was the first permit issued by the state of Pennsylvania for treating PFAS in drinking water using ion exchange resin.
Influent Water Characteristics
Influent concentration of a total of seven PFAS during the test period from November 2016 to August 2018 was an average of 103 ppt, a minimum of 78 ppt, and a maximum of 147 ppt. Individual PFAS concentrations are shown in Table 15-3. Average influent values for PFOS and PFOA were 34.1 and 20 ppt, respectively, somewhat lower than USEPA’s 70 ppt combined 2016 HA. Other influent geochemical parameters included sulfate at 8–23 ppm, nitrate at 10–11 ppm, alkalinity at 148–232 ppm, chloride at 35–50 ppm, pH at approximately 7.5, TDS at 296–358 ppm, suspended solids at 0.5–0.6 ppm, TOC at 0.2 ppm, and one sample detection for 1,1-dichloroethane at 37 ppt.
Table 15-3. Influent PFAS Characteristics of Well 10 *
| nanograms per liter (ng/L) (or parts per trillion (ppt)) | ||||||||
|---|---|---|---|---|---|---|---|---|
| PFBS | PFHpA | PFHxS | PFHxA | PFNA | PFOS | PFOA | Total PFAS | |
| Lab Detection Level | 1 | 1 | 2 | 1 | 2 | 2 | 1 | |
| Minimum | 6 | 4 | 17 | 6 | 27 | 13 | 78 | |
| Average | 9 | 5 | 28 | 9 | 34 | 20 | 103 | |
| Maximum | 14 | 8 | 41 | 13 | 2 | 48 | 40 | 147 |
| * PFBS =perfluorobutanesulfonate; PFHpA = perfluoroheptanoate; PFHxA = perfluorohexanesulfonate; PFHxA = perfluorohexanoate; PFNA = perfluorononanoate, PFOS = perfluorooctanesulfonate, PFOA = perfluorooctanoate, PFAS = total poly- and perfluoroalkyl substances | ||||||||
Treatment Technology Design Details: GAC and Ion Exchange System
Well 10, with a peak design flow rate of 100 gpm, was used for large-scale piloting at a reduced flow rate of 50 gpm under the terms of the permit from PA DEP. The water was first passed through a 20-micron suspended solids filter, then in series through two 2.5-ft diameter stainless steel vessels, each vessel containing 20 cubic feet of bituminous GAC. EBCT for each charge of GAC amounted to 2.8 minutes or a total of 5.6 minutes for the two GAC vessels; linear velocity was approximately 10 gpm/ft2. The township recognized that EBCT was lower than the 10–20 minutes specified in the PA Public Water Supply design manual and that linear velocity, even though it complied with the PWS, was higher than the typical 4 gpm/ft2 used for GAC; however, the township and PA DEP considered the design acceptable for the low levels of PFAS measured and for the temporary nature of the pilot. After initial treatment by the GAC pilot, the water was passed through a 2.5-ft diameter vessel containing 20 cubic feet of Purolite Purofine PFA694E selective resin. Bed depths for both the GAC and resin media were approximately 34 inches. Sampling points were installed on the outlet of each vessel. An extra sampling point was installed in the resin polishing vessel at two-thirds of the resin bed depth. This allowed monitoring corresponding to EBCT of 1.8 minutes at the two-thirds sampling point and 2.8 minutes EBCT for the entire resin bed. The two-thirds sampling point would provide advanced notice of PFAS breakthrough.
System Performance
The entire system became operational on November 29, 2016. PFOS and PFOA sampled at the two-thirds point of the resin bed remained consistently at nondetect levels until rising to 2.6 ppt on day 394 and 4 ppt on day 472 (see Figure 15-9). For reporting purposes, the township decided to use a minimum reporting level of 2.5 ppt for each of PFOS and PFOA; values below the minimum reporting level would be considered nondetect. Once the PFOA concentration reached 2.6 ppt at the two-thirds sampling point for the resin, the treated water was diverted to the local sanitary sewer in keeping with the PA DEP permit. PA DEP has since granted permission to bypass the GAC system to enable performance evaluation of just the resin.
On day 514, with permission from PA DEP, the two GAC vessels were taken out of service while the raw water was routed directly to the resin vessel, which continued to operate. In this way, the performance of the resin could be evaluated without pretreating with the GAC. The resin operated for 639 days before PFOA was detected at a concentration of 2 ng/L of PFOA in an effluent sample from the resin bed. At that point the concentrations of PFBS, PFHxS, and PFOS were still at nondetect levels. Operating capacity of the resin at that point was equivalent to treating 511,000 bed volumes (BVs) of water based on two-thirds of the resin volume, or 329,000 BV based on the entire volume of resin.
Following successful and consistent performance of the resin-only system, PA DEP has issued an operating permit for use of resin only in a pair of lead-lag ion exchange vessels. Similar permits have also been issued at neighboring townships.
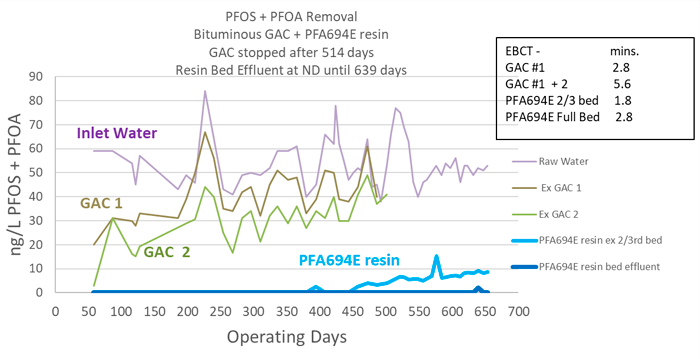
Figure 15-9. Combined PFOS/PFOA breakthrough.
Source: F. Boodoo, Purolite Corporation. Used with permission.
Even though PFOS and PFOA were the initial targets for reduction, consistent reduction of other short- and long-chain PFAS to nondetect levels was also achieved after passage through the resin. For conciseness, only total PFAS breakthrough graphs are shown in Figure 15-10, but the order of breakthrough observed was PFHxA < PFHpA < PFOA < PFNA < PFBS < PFHxS < PFOS.
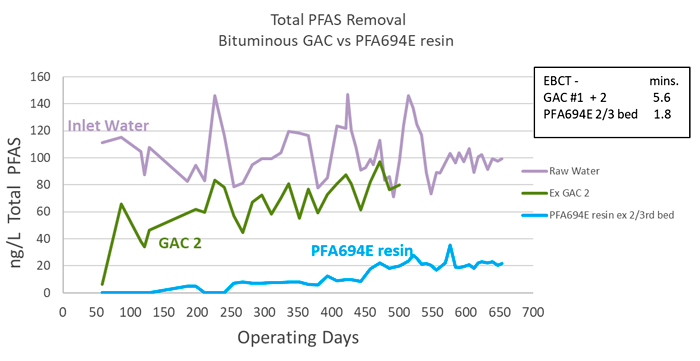
Figure 15-10. Combined breakthrough of total PFAS.
Source: F. Boodoo, Purolite Corporation. Used with permission.
Costs
The proposed permanent full-scale system is designed for a peak flow rate of 100 gpm with a pair of lead-lag vessels for the media. Design for ion exchange will include one 20-micron cartridge filter followed by two 4-ft diameter vessels with resin bed depth of 36 inches and EBCT of 2.8 minutes. Design for GAC will be one 20-micron cartridge filter followed by two 6-ft diameter vessels with GAC bed depth of 60 inches and EBCT of 10.6 minutes.
Annual operating cost, including replacement media, labor, trucking, spent media profiling, and incineration, is estimated at approximately $8,000 and $15,000, respectively, for ion exchange and GAC. These estimates are based on a very conservative operating capacity estimate of 350,000 BVs for a lead-lag pair of resin vessels; a generous capacity of 34,000 BVs is assumed for the GAC system. Operating costs are estimated at $0.16 and $0.29 per 1,000 gallons of water treated by the resin and GAC systems, respectively. Larger vessels needed for the GAC system will further add to the cost of using GAC versus the PFAS-selective resin.
15.2.2.2 Regenerable IX (2020)
Case Study: Regenerable Ion Exchange Resin Pilot Test and Full-Scale Application (Contributed by Steve Woodard, ECT2, and Nathan Hagelin, Wood Group, used with permission)
Background
The Air Force Civil Engineering Center (AFCEC) is conducting ongoing response activities to remove and remediate groundwater impacted by poly- and perfluoroalkyl substances (PFAS) at the former air force base in New Hampshire. The two primary PFAS found at the site are perfluorooctanoic acid (PFOA) and perfluorooctane sulfonate (PFOS), at combined concentrations (PFOA+PFOS) above the 2016 USEPA lifetime health advisory (LHA) of 0.07 micrograms per liter (µg/l). In 2015, the USEPA issued an administrative order to establish maximum hydraulic containment of PFAS compounds to reduce source zone mass and mitigate migration of PFAS compounds to off-site receptors.
AFCEC responded by contracting with Wood Group, PLC, to conduct a side-by-side pilot test in 2016, comparing the performance of Emerging Compound Treatment Technologies’ (ECT2) regenerable ion exchange (IX) resin and bituminous GAC. The resin outperformed GAC and was selected for full-scale implementation, mainly on its life cycle cost advantages, as determined by the results of the pilot study.
To evaluate the resin’s ability to be regenerated, regeneration trials were conducted throughout the pilot test using a proprietary regeneration procedure with a solution of organic solvent and brine. Overall, PFAS removal results for the regenerated resin were consistent with new resin, as shown in Figure 15-11. Extended follow-on pilot testing utilized multicycling to confirm the effectiveness of the regeneration procedure to restore the resin’s PFAS removal capacity. The regenerable resin system was selected for full-scale application, based on system performance and a favorable life cycle cost comparison.
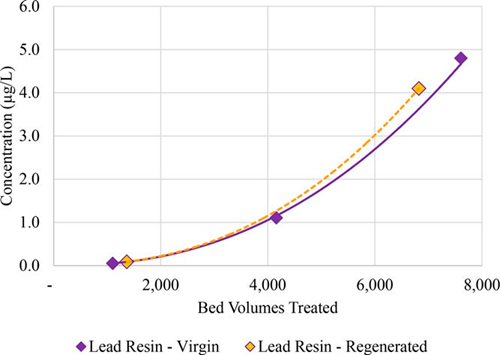
Figure 15-11. Postregeneration breakthrough curve (total PFAS).
Source: Steve Woodard, ECT2, and Nathan Hagelin, Wood Group, PLC. Used with permission.
Influent Water Characteristics
Table 15-4 provides a summary of influent PFAS concentrations observed throughout the pilot test. Total PFAS concentrations ranged from 65 to 112 µg/l, with an average of 94 µg/l. Average influent concentrations for PFOS and PFOA were 26 and 12 µg/l, respectively. Influent general chemistry parameters included pH of 6.8, alkalinity of 115 milligrams per liter (mg/l), TDS of 230 mg/l, total suspended solids of less than 2 to 5.6 mg/l, sulfate of 17 mg/l, TOC of 4.5 mg/l, and chloride ranging from 30 to 250 mg/l.
Table 15-4. Influent PFAS Concentrations
| Influent Concentration Observed During Pilot Test (µg/L) | ||||
|---|---|---|---|---|
| Analyte | Analyte Acronym | Low | High | Average |
| 6:2 Fluorotelemer sulfonate | 6:2 FTS | 15 | 22 | 18 |
| 8:2 Fluorotelemer sulfonate | 8:2 FTS | 0.055 | 0.3 | 0.23 |
| Perfluorobutane sulfonate | PFBS | 0.81 | 1.3 | 1.1 |
| Perfluorobutanoic acid | PFBA | 0.89 | 2.1 | 1.3 |
| Perfluoroheptane sulfonate | PFHpS | 0.85 | 1.4 | 1.1 |
| Perfluoroheptanoic acid | PFHpA | 1.6 | 2.2 | 1.9 |
| Perfluorohexane sulfonate | PFHxS | 18 | 25 | 22 |
| Perfluorohexanoic acid | PFHxA | 5.9 | 8.9 | 7.7 |
| Perfluorooctanoic acid | PFOA | 9.1 | 13 | 12 |
| Perfluoronananoic acid | PFNA | 0.046 | 0.082 | 0.054 |
| Perfluorooctane sulfonate | PFOS | 4.2 | 32 | 26 |
| Perfluoropentanoic acid | PFPeA | 3.1 | 5.1 | 4.2 |
| Sum of PFAS | – | 65 | 112 | 94 |
Treatment Technology Design Details for Full-Scale System
The permanent full-scale resin system was designed for a maximum flow rate of 200 gpm (0.76 m3/min), with influent total PFAS concentrations of approximately 90 µg/l. The primary project objective was to consistently produce treated water with combined PFOS plus PFOA concentrations below the 2016 USEPA lifetime health advisory (LHA) of 0.07 micrograms per liter (µg/l). The full-scale IX resin system was installed between fall 2017 and spring 2018, and the system officially commenced operation in April 2018.
Figure 15-12 shows a process flow diagram of the treatment system. The pretreatment portion includes bag filters to remove suspended solids and 6000-lb backwashable liquid GAC pretreatment filter to remove iron. The PFAS removal system consists of two parallel trains of lead-lag regenerable IX resin vessels, each 86″ tall x 36″ diameter, packed with 49 cubic feet of ECT’s SORBIX A3F regenerable resin. These vessels are designed to operate up-flow during normal operation, and down-flow during regeneration. Two parallel, 86″ tall x 36″ diameter polish vessels are filled with IX resin for PFAS polishing, including short chains. The polish vessels operate in the down-flow mode and contain a blend of IX resins tailored to the general water chemistry and PFAS species and their relative concentrations.
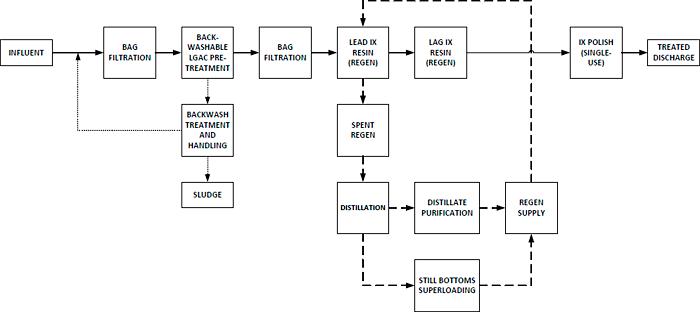
Figure 15-12. Block flow diagram of full-scale treatment system.
Source: Steve Woodard, ECT2, and Nathan Hagelin, Wood Group, PLC. Used with permission.
The in-vessel regeneration system (Figures 15-13 and 15-14) consists of a regenerant solution holding tank and pump skid. The regenerant solution is a mixture of organic solvent and brine, which effectively strips PFAS from the IX resin and then flows into a spent regenerant holding tank. The spent regenerant is recycled for reuse in the next regeneration cycle by using a distillation and super-loading process. First, the spent regenerant is transferred to a solvent recovery unit. Solvent makes up the majority of the regenerant solution and is recovered through distillation, given its low boiling point relative to water, and transferred to the regenerant supply tank for reuse in the next regeneration cycle. The remaining distillate residue, known as the “still bottoms,” is a low-volume, high PFAS concentration brine solution. The still bottoms are pumped through super-loader vessels that contain a proprietary resin blend, transferring the PFAS mass onto the super-loaded media. Super-loading is the process by which a relatively small volume of highly concentrated PFAS solution is passed very slowly through a small volume of media. The long EBCT approaches equilibrium (isotherm) conditions, thereby maximizing PFAS mass transfer onto the media and minimizing the amount of solid waste requiring disposal or incineration.
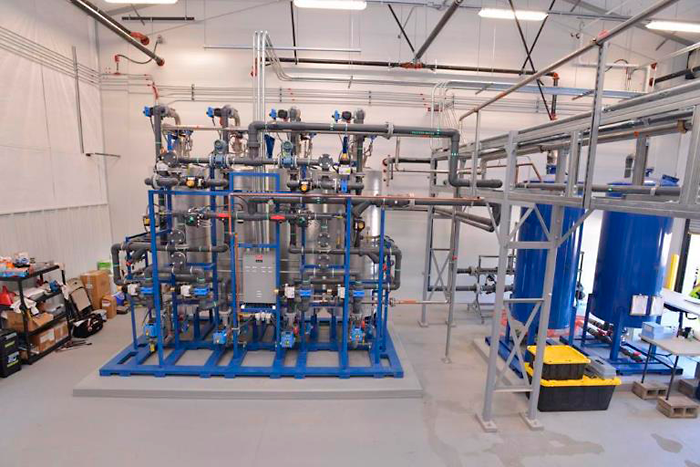
Figure 15-13. Regenerable and polish IX resin vessel skids.
Source: Steve Woodard, ECT2, and Nathan Hagelin, Wood Group, PLC. Used with permission.
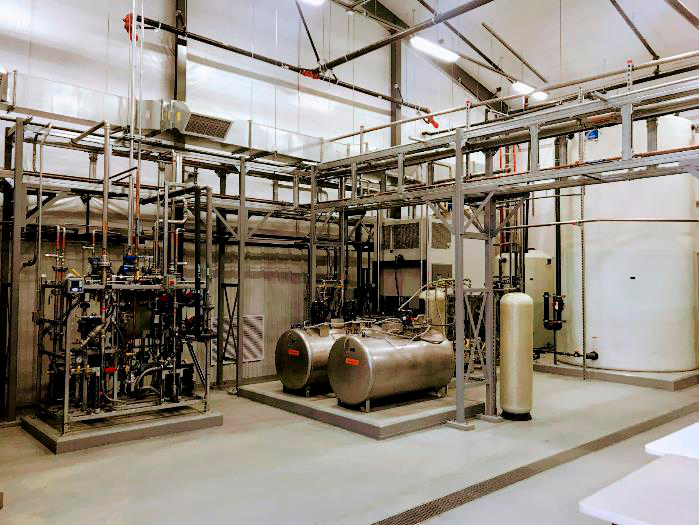
Figure 15-14. Resin regeneration system.
Source: Steve Woodard, ECT2, and Nathan Hagelin, Wood Group, PLC. Used with permission
System Performance
The PFAS remediation system has been successfully treating the groundwater since system start-up in April (Figure 15-15). Through December 2018, the effluent water quality from the IX resin system has been consistently nondetect for the monitored PFAS compounds, including the short-chain species, readily achieving compliance with the treatment objective of 0.70 µg/l LHA target for PFOS and PFOA. Although 6:2 FTS has not been detected in samples collected from the IX vessel effluent, it has been detected in the system effluent and is believed to be the result of transformation processes that are not yet understood.
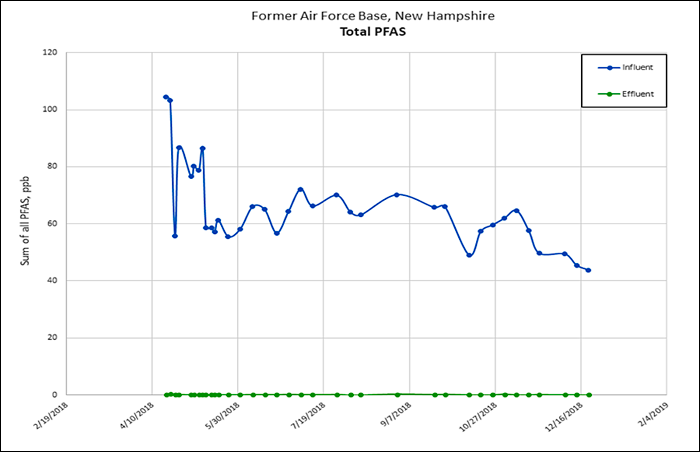
Figure 15-15. Influent and treated effluent total PFAS concentrations.
Source: Steve Woodard, ECT2, and Nathan Hagelin, Wood Group, used with permission
The system has been operated in the 35- to 70-gpm range since start-up, somewhat less than the design flow rate. This has been done to accommodate higher than anticipated influent iron concentrations that have resulted in the requirement for frequent bag filter change-outs. The resulting extended EBCTs in both the backwashable GAC pretreatment vessel and the IX resin vessels have resulted in better than projected PFAS removals. Also, the resin regeneration schedule has been modified to accommodate the lower flow rate by removing one of the two parallel trains from service. This has allowed the resin vessels to be loaded closer to design values. Four resin regenerations have been performed successfully through December 2018; however, the IX media regenerated through December 2018 was not loaded to the full design capacity due to the reduced flow during early operation. Operational modifications have been made to address and correct minor challenges with the distillation system, and regenerant recovery and super-loading processes have proven successful. The original super-loading media is still operational, having removed and concentrated greater than 99.99% of the recovered PFAS mass; therefore, no PFAS waste has needed to be hauled off site to date.
Costs
The capital cost for the regenerable IX was $2.9M for all treatment equipment, process piping, pumps, instrumentation, and system electrical. It does not include project management, construction management, the extraction network and field piping, or the building and building mechanical or electrical systems.
15.2.3 Colloidal Activated Carbon (2023)
Case Study: In Situ Colloidal Activated Carbon—PFAS in Groundwater in Crawford County, Michigan (Contributed by Scott Wilson, Regenesis, used with permission)
Background
Since the late 1980s, the Michigan Department of Military and Veterans Affairs (DMVA) has been implementing a range of technologies to remediate groundwater impacted by chlorinated solvents at Camp Grayling in Crawford County, Michigan, a year-round training center for the Michigan Army National Guard (MIARNG). In 2016, the DMVA became aware of the potential contamination of PFAS from past operations such as on-site firefighting training at Grayling Army Airfield (GAAF). Groundwater testing revealed PFAS commingled with chlorinated solvents migrating toward the property boundary. The impacted groundwater was shallow at 15 feet below ground surface (bgs) and was shown to be moving at a velocity of about 250 ft/yr through a sandy gravel aquifer. Sensitive downgradient receptors included numerous residences and surface water bodies. See also Regenesis (2020) for more information.
Contaminant Characteristics
Target groundwater contaminants at the GAAF site included PFAS (PFOS and PFHxS) at a combined concentration of about 130 ng/L commingled with perchloroethylene (PCE), which was present at a concentration of about 10 ug/L. Data from dedicated passive flux samplers deployed at the project site indicated that groundwater contamination was primarily existing in a sandy contaminant flux zone located between 15 and 27 feet bgs.
Regulatory Involvement
The DMVA decided to perform a demonstration of in situ colloidal activated carbon (CAC) technology to treat the PFAS and PCE contamination at the GAAF site. This demonstration consisted of injecting CAC into a zone of the contaminated aquifer and actively monitoring groundwater moving through the treatment area. The primary reason DMVA chose this approach was its proven performance on other project sites where it rapidly removed PFAS from the dissolved phase and was expected to perform for decades with a single application. “Additionally, the project life-cycle cost was a consideration for the DMVA in their selection. The projected cost for installing” an in situ CAC treatment zone in the subsurface was significantly lower than installing and “operating a mechanical system over a similar timeframe” (Regenesis 2020).
Treatment Technology
CAC is composed of very fine particles of activated carbon (1–2 μm) suspended in water using organic polymer dispersion chemistry. When the CAC material is injected into the subsurface, the carbon particles bind to the aquifer matrix but do not obstruct pore throats. Groundwater flows through the treatment zone. Organic compounds such as PFAS sorb on to the carbon particles, removing them from groundwater.
To determine the amount of CAC required for the demonstration, a proprietary finite-difference model was used to determine dosing of carbon, expected contaminant retardation/competitive sorption, and expected performance longevity. The model accounts for site-specific factors such as hydrogeology and contaminant flux while considering competitive sorption and biodegradation (in the case of PCE) to determine the quantity of CAC required.
Ultimately “the application design consisted of a single row of nine direct push injection points positioned upgradient of a previously installed monitoring well, MW-29” (Regenesis 2020). The total amount of CAC injected was 2,400 lbs of a 4% (w/w) suspension and 2,400 lbs of a 20% (w/w) suspension. “The injection line was configured as an arc to account for temporal and spatial variability in the groundwater flow direction. Initially two downgradient well pairs (MW-29/29C and MW-29D/29E) were placed 6 feet and 16 feet downgradient of the barrier, respectively, to monitor the pilot test performance. Each well of a well pair was installed with a 5-feet screened section to monitor the upper and lower treatment interval sections” (Regenesis 2020). Figure 15-16 shows the monitoring well layout.
“The vertical injection interval was specified from 15 to 27 feet below the ground surface (bgs) to match the PFAS flux zone and accommodate seasonal water table fluctuations. In the pilot test area, this PFAS flux zone predominantly comprised of sand and gravel overlying a clay layer” (Regenesis 2020).
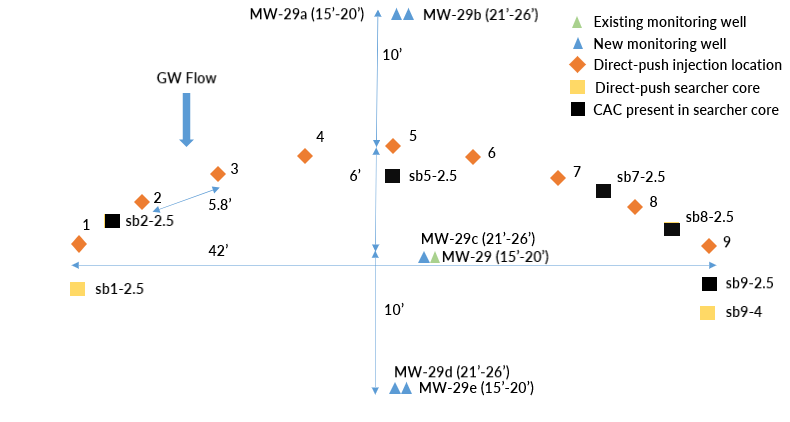
Figure 15-16. Wells used for the CAC demonstration project. Note that the values after the dash in the “sb” points are the distance from the injection point.
Source: Scott Wilson, Regenesis, used with permission.
Injection of the CAC zone commenced in October 2018. Subsurface CAC distribution was optimized during injection by “adjusting injection variables including flow rate, screen size, injection volume, and injection point positioning” (Regenesis 2020). Verification of required CAC distribution was achieved “by collecting soil cores and groundwater samples from temporary piezometers placed between injection points. The soil cores revealed consistent CAC distribution over the target interval, while the groundwater samples collected from the piezometers indicated” (Regenesis 2020) required CAC presence in groundwater (Figure 15-17).
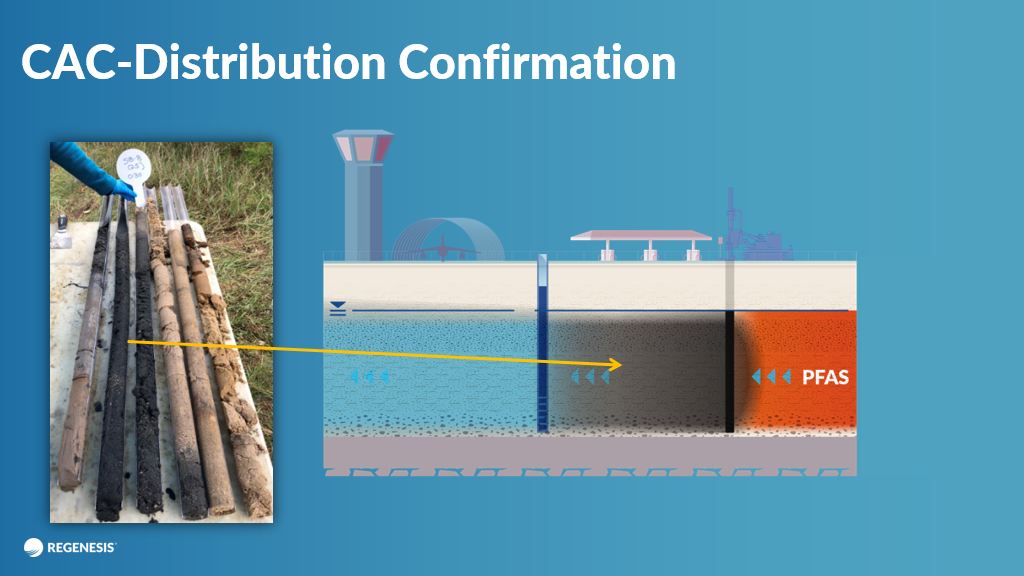
Figure 15-17. Vertical sections of a “searcher core” verifying the presence of CAC at the interval between 15 and 28 feet bgs.
Source: Scott Wilson, Regenesis, used with permission.
System Performance
By the first sampling event, approximately one month after injection, the CAC zone treatment had reduced PFAS “to concentrations below the standard method detection limit of 10 nanograms per liter (ng/L) in downgradient wells. Initial reductions were also observed in upgradient well-pair (MW-29A/B), indicating potential injection influence. However, by the second event, approximately two months after injection, concentrations in these upgradient wells had begun to rebound while the downgradient wells remained at non-detect” (Regenesis 2020). Since then, the CAC treatment has maintained PFAS concentrations below 10 ng/L in the downgradient wells for 3.5 years. Figure 15-18 includes PFAS concentration data for upgradient and downgradient well pairs.
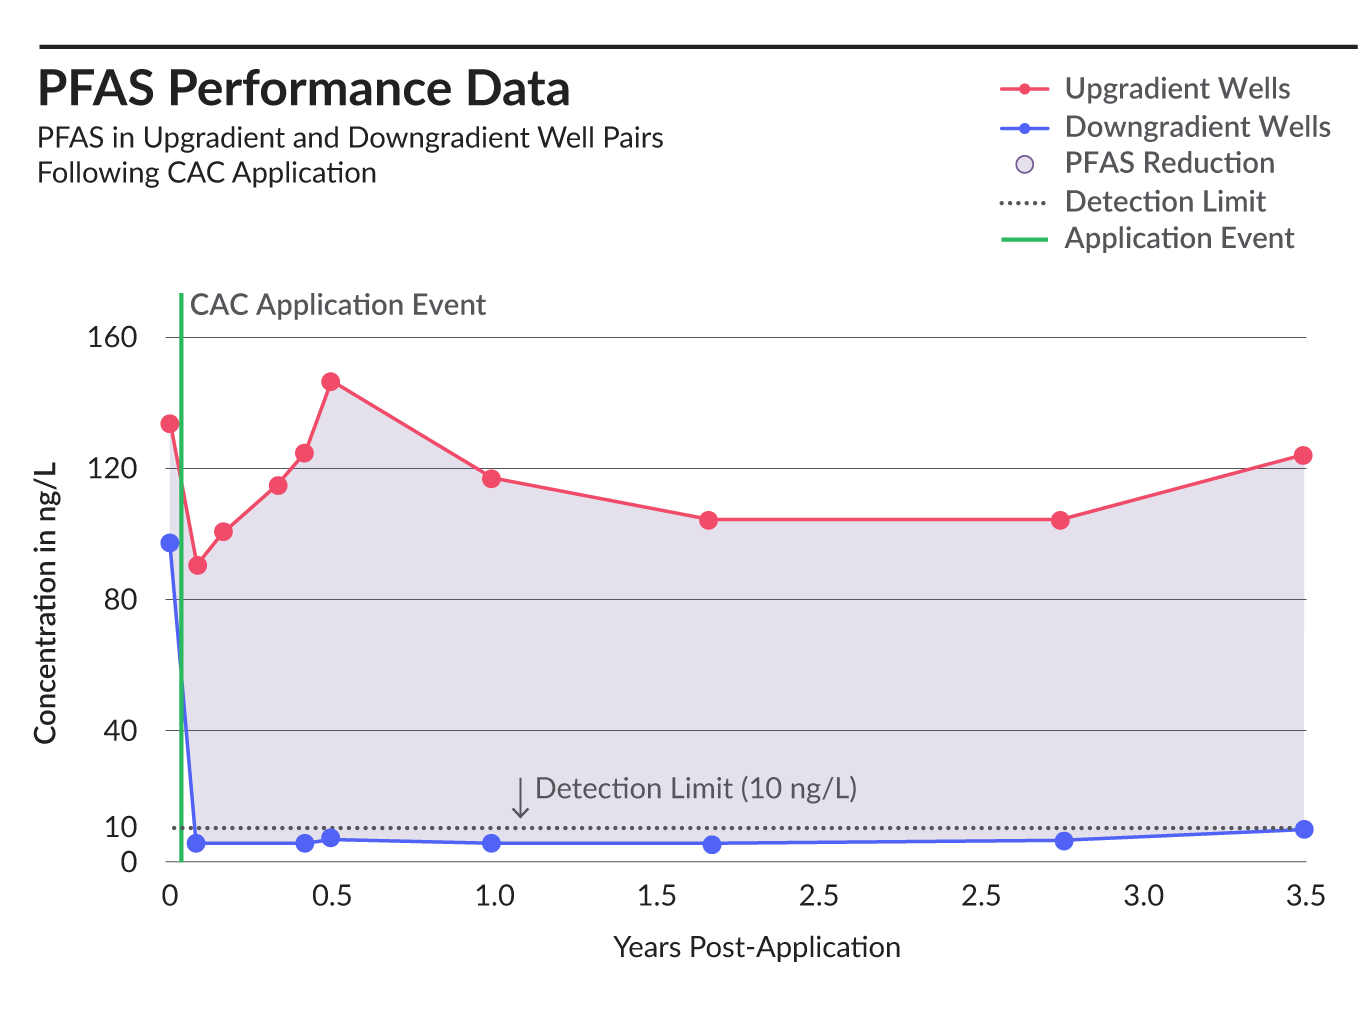
Figure 15-18. PFAS reductions as an average of monitoring well concentrations downgradient of CAC-treated zone.
Source: Scott Wilson, Regenesis, used with permission.
PCE concentrations followed a similar pattern as PFAS: reduction to nondetect (1 microgram per liter) by the first month, followed by sustained nondetect levels. Figure 15-19 includes PCE concentration data for upgradient and downgradient well pairs.
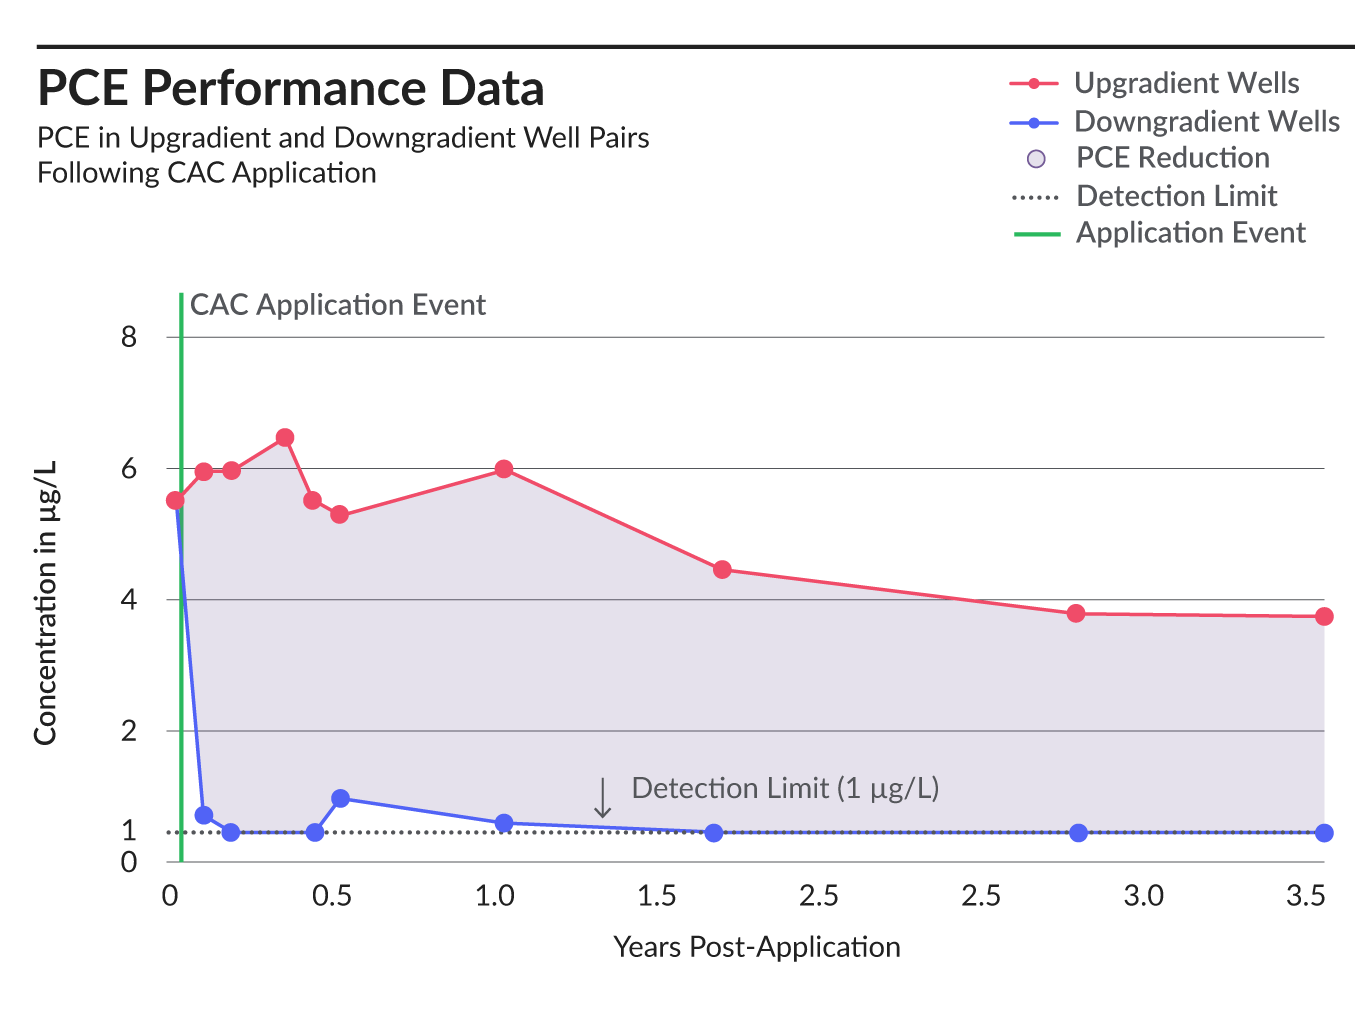
Figure 15-19. PCE reductions as an average of monitoring well concentrations downgradient of CAC-treated zone.
Source: Scott Wilson, Regenesis, used with permission.
The CAC demonstration has achieved all the remedial objectives to date (3.5 years) while modeling predictions suggest that the CAC installed will continue to remove PFAS and PCE for decades. Based on this demonstration project, the Michigan DMVA is considering expanded use of in situ CAC technology at other sites.
Cost
The total installation cost of the demonstration project was about $55,000, including the CAC material cost of $28,000 and field labor/subcontracting cost of about $27,000. There is no operation or maintenance cost. Sampling and analysis totals about $6,200 per year.
15.2.4 Foam Fractionation
15.2.4.1 Ex situ Groundwater Treatment (2023)
Case Study: Field Trial Conducted for the Australian Department of Defence (2019-2021) in Queensland, Australia (Contributed by David Burns, EPOC Systems)
EPOC Enviro LLC (USA), a subsidiary of OPEC Systems (Australia), was contracted by the Australian Department of Defence to provide a groundwater treatment field trial plant at the Army Aviation Centre Oakey in Queensland, Australia. The field trial project was managed by WSP with project management and contract administration provided by GHD. The field trial plant required a design capacity to treat 250 m3/day (2.9l/sec or 46 gpm) to remove PFAS from groundwater, which included the primary treatment technology known as Surface-Active Foam Fractionation (SAFF®) and paired with an anion exchange (AIX) resin polishing treatment to ensure compliance with Australian and New Zealand Heads of EPAs (HEPA) drinking water guideline criteria prescribed by the PFAS National Environmental Management Plan (NEMP, V2, Jan. 2020). Groundwater had historically been contaminated by AFFF discharges from 1977 to 2005. Following the 3-year field trial, the Australian Department of Defence subsequently awarded a continuation of the groundwater treatment plant contract with increased treatment capacity of 345 m3/day (4.0l/sec or 63 gpm) and an expanded irrigation network.
A full case study is provided in the Burns et al. (2021) article, “PFAS Removal from Groundwaters using Surface-Active Foam Fractionation.” https://onlinelibrary.wiley.com/doi/10.1002/rem.21694.
15.2.4.2 Ex situ Landfill Leachate Treatment (2023)
Case Study: Field Trial Conducted for Telge Återvinning AB, Sweden (2021–2022) (Contributed by David Burns, EPOC Systems)
EPOC Enviro LLC (USA), a subsidiary of OPEC Systems (Australia), was contracted by Telge Återvinning AB to provide a containerized treatment plant to treat leachate at the Telge Recycling Plant in Sweden. The initial field trial and project management were provided by EnvyTech Solutions AB. The treatment plant required a design capacity to treat 500 m3/day (5.8l/sec or 92gpm) to remove PFOS from landfill leachate water using Surface-Active Foam Fractionation (SAFF®) without any pretreatment or polishing treatments. The leachate, which exhibited a complex background chemistry including algal/zooplankton content, suspended solids, total organic carbon, and other organic and inorganic contaminants, was contained in a catchment pond with a volume of approximately 15,000 m3. A direct feed line drew water from the leachate pond to the SAFF® treatment plant using a submerged pump located approximately 1.5 m below the surface. The system achieved average treatment results for PFOS ≤2.34 ng/L, PFHxS ≤1.00 ng/L, and PFOA ≤1.28 ng/L, corresponding to removal percentages of ≥98.7%, ≥98.8%, & ≥99.7%, respectively. The mean concentration of PFOS was below 50 ng/L, which is defined by the voluntary Scandinavian REVAQ guideline.
A full case study is provided in the Burns et al. (2022) article, “Commercial‐scale remediation of per‐ and polyfluoroalkyl substances from a landfill leachate catchment using Surface‐Active Foam Fractionation (SAFF®): https://doi.org/10.1002/rem.21720.
15.2.4.3 PFAS Treatment Train Processing Using Surface-Active Foam Fractionation (SAFF®) and Eight Different PFAS Destruction Technologies—Lake Elmo, Minnesota (2025)
Contributed by Rebecca Higgins, AECOM, and Andri Dahlmeier, MPCA, used with permission.
The purpose of this case study is to present an example of a PFAS treatment train. While conditions at other locations will vary from the case study here, the results below are encouraging for application at other remediation sites. The full details of these results can be found in the final Project 1007 Feasibility Study report upon completion (MPCA 2023). Additional information about foam fractionation is included in Section 12.2.3 of the Guidance Document. A surface water quality case study that describes PFAS-containing foam for Project 1007 is included in Section 15.5.1.
Background
The Project 1007 Corridor is in the Twin Cities East Metro Area of St. Paul, Minnesota, and is a large flood control project constructed by the Valley Branch Watershed District to mitigate flooding in the landlocked subwatershed of the Tri-Lakes area. The conveyance system, consisting of open channels, pipes, dams, storm sewers, and existing surface water bodies, directs water from the Tri-Lakes area in Washington County to the St. Croix River. Within the drainage area of Project 1007, two PFAS source areas were identified as the former Oakdale Disposal Site and the closed Washington County Landfill. In addition to groundwater impacts resulting from two disposal areas, Project 1007 also facilitated a direct surface water to groundwater pathway along the corridor. This has resulted in widespread impacts extending approximately 120 square miles within six groundwater aquifers, including those used for drinking water in the Twin Cities East Metro. Impacts span multiple watersheds, groundwater divides, and drinking water supply aquifers. To read the full extent of investigation, including characterization and initial findings, please refer to the Source Assessment Progress Reports located on the Project 1007 website (MPCA 2023).
While the extent of the problem is still being defined, potential remedial options have been defined. Initial concepts of a remedial treatment train involved several steps. First, a concentration/separation step (for example, foam fractionation, reverse osmosis, filtration via granular activated carbon (GAC) or ion exchange resin (IX) for bulk PFAS removal from the source water. While these methods are typically effective at achieving applicable standards, it may be advantageous for the PFAS to be concentrated in an aqueous form. This may reduce operation and maintenance costs by reducing or eliminating the need for filtration media. This also allows for more options to destroy the PFAS removed from the bulk liquid.
This case study evaluated the treatment train of using foam fractionate to separate and concentrate PFAS prior to the testing of multiple PFAS destruction vendors.
SAFF® Process
SAFF® is a proprietary foam fractionation process that uses the foaming properties of PFAS to capture and concentrate PFAS in water. This technology takes advantage of the fact that PFAS are generally both hydrophobic and hydrophilic. The process effectively concentrates PFAS in foam at the water surface, which can be skimmed or vacuumed off the top. The SAFF® specifically uses a two-step process to remove and then concentrate the PFAS into a smaller volume for further processing or disposal. A third concentration step can also be used to additionally concentrate the PFAS to reduce costs associated with destruction. This was manually attempted as part of this pilot study. Additional information about foam fractionation can be found in Section 12.2.3 and Section 18.4. More information about this pilot study can be found in the Project 1007 Feasibility Study (MPCA 2023).
Environmental Site Description and Results
The foam fractionation system was located in Tablyn Park (City of Lake Elmo) because of the ease of access to – impacted surface water (Raleigh Creek) and the two impacted aquifers (Shakopee and Jordan). These three water sources were treated separately by the foam fractionation system to better evaluate the treatment efficiency with different PFAS concentrations and water chemistries. A SAFF20 was deployed, which contains two primary fractionation vessels that remove PFAS from the bulk water, and a single secondary fractionation vessel which further concentrates the PFAS.
Treatment of water from Raleigh Creek showed a typical response in that foam readily formed during aeration, allowing PFAS to be removed from surface water. This foaming was a result of both PFAS and naturally occurring organic matter. With foam formation, PFOS and PFOA were readily removed from the bulk water treated at a treatment capacity of approximately 25,000–30,000 gallons per day (gpd) for the lowest effluent concentrations as shown in Table 15-2-5. Higher treatment capacities of up to 45,000 gpd could be achieved with PFOS and PFOA removal still above 95%. Other PFAS were also monitored. Longer chain PFAS, including perfluorohexanoic acid (PFHxS), were also removed; however, short-chain PFAS such as perfluorobutanoic acid (PFBA) had significantly limited removal efficiencies (less than 50%). Secondary fractionation treatment was tuned to limit the volume of water removed with the foam to reduce the PFAS concentrate to a volume of less than 0.5 gpd with attempts to meter the concentrate at small volumes back into the secondary fractionation step. This mimics tertiary fractionation.
Table 15-2-5. Removal efficiencies for PFOS and PFOA in the Tablyn Park study
| PFOS (ng/L) | PFOA (ng/L) | |||||
|---|---|---|---|---|---|---|
| Water Source | Influent | Effluent | Concentrate^ | Influent | Effluent | Concentrate^ |
| Raleigh Creek | 2,940 | 2.9 (99.9)* | 4,530,000 | 903 | 0.836 (99.9)* | 1,780,000 |
| Shakopee Aquifer | 1,340 | 1.42 (99.9)* | 19,100,000 | 392 | 3.57 (99.1)* | 6,360,000 |
| Jordan Aquifer | 0.92 | Below Detection | Not Available^ | 26.5 | 4.95 (81.3)* | Not Available^ |
Note: All analytical results were completed by USEPA Method 1633.
^Concentrate was mixed with concentrate from other water samples in system holding tank.
*Percent removal
The system responded differently during the groundwater treatment from both aquifers due to a lack of organic matter which limited the foam formation. . To achieve higher removal efficiencies without the addition of a surfactant, the aeration amount was oscillated between high and low air injection to promote removal. These results indicate high PFOS and PFOA removal regardless of the surface water chemistry and PFAS concentrations of the influent water. The effluent was discharged under Minnesota Pollution Control Agency (MPCA)–approved discharge to nearby Raleigh Creek.
Higher concentrations were achieved in the concentrate from the Shakopee Aquifer because of recirculation of the collected concentrate back into secondary fractionation by manually metering in the concentrate. This is similar to what is done during tertiary fractionation. This was not achieved with concentrate formed during Raleigh Creek treatment because the higher organic matter resulted in too much foaming during manual metering. The resultant concentrate from the treatment of Raleigh Creek and the Shakopee Aquifer was used for the PFAS destruction testing.
Destruction Technologies Descriptions
The next phase of the treatment train was to evaluate currently identified destruction technologies for further PFAS treatment. For the purposes of this case study, destruction is defined as the process of transformation and reduction of targeted PFAS, focused on PFOA and PFOS. Total organofluorine, often measured as adsorbable organofluorine, was also used to measure reductions in total PFAS. The definition of destruction may differ among various technology vendors, and the reader is encouraged to specifically define destruction within pilot studies to establish a common reference and goal for varied technologies.
The MPCA posted a request for proposals for bench-scale testing of destruction technologies with the surface water foam fractionation concentrate. Responses were received for four categories of destructive technologies, some with multiple vendors that were considered for further testing. These included plasma, (1 vendor), UV-activated photoreduction (2 vendors), supercritical water oxidation (3 vendors), and electrochemical oxidation (1 vendor) (Table 15-2-6). See Section 12.2 and Section 12.6 for more information about water treatment technologies. A second electrochemical oxidation vendor was also tested in a pilot-scale demonstration with the concentrate from treatment of the Shakopee Aquifer. As bench-scale and pilot-scale results are difficult to compare, the pilot-scale results are not presented in this case study. A recent peer-reviewed publication includes detailed explanations of these processes (Meegoda et al. 2022).
The destruction technology evaluation project was large, and considered many variables, including PFAS using multiple analytical methods. For brevity, here we present abbreviated results for two of the most studied PFAS, PFOA and PFOS.
Destruction Testing Results
The PFAS concentrate from the foam fractionation system in Tablyn Park was sent to the vendors for processing through their PFAS destruction systems. Note that the initial PFAS values in Table 15-2-6 and Table 15-2-7 do not match those seen in Table 15-2-5, as some vendors performed dilutions to either increase the volume of waste for processing to accommodate the treatment capacity of their pilot unit (Vendor E) or to increase the transmittance (decrease natural organic matter concentration) of a sample (Vendor B). These variations in influent concentrations for Vendors B and E and the resulting final concentrations are shown in the tables below. While dilutions would not be required in the first instance in a field application, they would likely still be required in the second instance.
Table 15-2-6. PFAS destruction technology results for Tablyn Park foam fractionation concentrate, PFOA*
| Technology | Vendor | Initial | Final |
|---|---|---|---|
| Plasma | Vendor A | 1,700,000 | 290 |
| Photochemical | Vendor B | 338,100 | 20 |
| Vendor B | 314,600 | 70 | |
| Vendor C | 1,500,000 | 86 | |
| Supercritical Water Oxidation | Vendor D | 971,000 | Not reported |
| Vendor E | 33,000 | 29 | |
| Vendor E | 34,000 | 12 | |
| Vendor E | 36,000 | 7.2 | |
| Vendor E | 132,146 | 7.3 | |
| Vendor F | 1,670,000 | Not reported | |
| Electrochemical Oxidation** | Vendor G | 11,380,000 | 3.8 |
*Values in ng/L
**Pilot testing was also performed using another electrochemical oxidation method. These tests were performed using equipment in the field, and preliminary results have shown promise in significant PFOS and PFOA destruction. Additional studies are in progress.
Table 15-2-7. PFAS destruction technology results for Tablyn Park foam fractionation concentrate, PFOS*
| Technology | Vendor | Initial | Final |
|---|---|---|---|
| Plasma | Vendor A | 3,200,000 | 2,100 |
| Photochemical | Vendor B | 930,700 | 230 |
| Vendor B | 1,072,900 | 2,400 | |
| Vendor C | 2,400,000 | 220 | |
| Supercritical Water Oxidation | Vendor D | 3,660,000 | Not reported |
| Vendor E | 120,000 | 44 | |
| Vendor E | 130,000 | 7.4 | |
| Vendor E | 150,000 | 7.6 | |
| Vendor E | 341,070 | 4.9 | |
| Vendor F | 3,510,000 | Not reported | |
| Electrochemical Oxidation** | Vendor G
|
4,160,000
|
3.8
|
*Values in ng/L
**Pilot testing was also performed using another electrochemical oxidation method. These tests were performed using equipment in the field, and preliminary results have shown promise in significant PFOS and PFOA destruction. Additional studies are in progress.
For the bench-scale results, the vendors targeted high destruction efficiencies. Multiple vendors noted that energy efficiencies may be achieved through reconcentration of the effluent from their systems. Instead of treating the concentrate to reach a discharge criteria, energy savings can be achieved by only treating waste with high PFAS concentrations. This may also reduce the number of systems required to treat the concentrate volume produced in a full-scale system.
Some vendors included other evidence of destruction. This is recommended in PFAS destruction testing. This included analysis of shorter chain PFAS, which results from sequential defluorination as is observed with photochemical reduction, electrochemical oxidation, and plasma. Increases in fluoride concentrations were also observed, but mass balances were not achieved. Some of the vendors also performed adsorbable organofluorine (AOF) and total oxidizable precursor (TOP) assay analysis, and this is recommended in the evaluation of destruction technologies. At this site, precursors are not found at high concentrations in the surface water and groundwater, so this was not of particular concern in the evaluation; however, elsewhere precursor analysis is important in understanding the destruction of all PFAS present. Additionally, AOF can provide insight into total PFAS destruction, including those compounds that are not included in USEPA Method 1633A. It should be noted that AOF does not capture ultra-short-chain PFAS (ultrashort PFAS). See Section 11.2, Section 1.5.3, and Section 1.5.4 for more information about PFAS analysis.
In addition to the destruction capabilities, other factors should be considered when evaluating destruction technologies. These include potential byproducts, the destruction (or potential production) of short-chain and ultrashort PFAS, air emissions, energy consumption, operating conditions, and operation and maintenance needs. Electrochemical oxidation, photochemical reduction, and plasma are all known to sequentially defluorinate longer PFAS, resulting in increases in shorter chain PFAS. Issues with high detection limits in the starting concentrate limited the analysis of the production of these PFAS. These items were evaluated as part of the larger study but are not discussed here, because these items often require larger pilot studies to fully evaluate. Cost information was provided by some of the vendors, but those that included full-scale systems did caution that the costs were high-level estimates and that additional testing at the pilot scale would be required to better complete cost estimations. The treatment cost is also highly dependent on the treatment goals. Treatment for longer times or at higher energies can result in lower effluent concentrations, but this can also greatly increase energy demands and decrease treatment capacity, requiring larger systems to be installed.
Conclusions
Results suggest the four types of destruction technologies examined all provide a significant level of PFOA and PFOS reductions. Additionally, results indicate a treatment train approach using foam fractionation can be an effective method of decreasing the volume of PFAS-contaminated water that requires treatment, making PFAS destruction technologies more implementable and cost-effective. Many of the technologies also operate more efficiently at higher PFAS concentrations. Selection of a destructive technology depends on site-specific water chemistry, and multiple destruction technologies should be considered to evaluate potential interferences. For example, foam fractionation can concentrate natural organic matter, which decreases transmittance and decreases efficiency of one of the UV-activated photoreduction technologies. While some of the technologies had higher effluent concentrations, the effluent from destruction can be cycled back through the foam fractionation system to reconcentrate the remaining PFAS, further supporting a treatment train approach. Filtration with granular activated carbon or ion exchange could also be employed as a polishing step to further treat the effluent of the foam fractionation system if needed to meet the applicable regulatory criteria or site-specific goals.
For Project 1007, additional testing of the PFAS concentrate and subsequent destruction technologies may be conducted to determine the effectiveness with different PFAS mixtures and water chemistries. This will likely not occur until the location of the potential full-scale system is selected, as this may impact the PFAS mixture and concentration in the resulting PFAS concentrate treated by the destruction technologies. The results of this pilot study have been incorporated into a feasibility study to assess remedial options to reduce the migration of PFAS impacts within the East Metro.
15.2.5 Soil Washing
15.2.5.1 Full-scale Soil Washing of PFAS-contaminated Soil Stockpiles, Alaska (2025)
Case Study: Full-scale Soil Washing of PFAS-contaminated Soil Stockpiles, Alaska. Contributed by Toni Mehraban, Brice Engineering, LLC, Used with permission.
Background
During construction of new facilities and infrastructure at a military installation in Alaska, potentially PFAS-impacted soil was excavated during building foundations, site grading, and utility installation. To avoid construction delays, 145,793 cubic yards (cu yd) of soil was stockpiled on the installation. Through characterization in 2021, approximately 139,098 cu yds were determined to be impacted with PFAS and co-contaminants above Alaska Department of Environmental Conservation (AK DEC) cleanup levels (CULs). The installation disposed of 11,972 cu yds of PFAS-impacted soil off-site and in 2022 Brice Engineering, LLC (Brice) and their soil washing technology was selected to treat the remaining 127,126 cu yds in 42 stockpiles through a patented soil washing process with an objective to reduce levels below AK DEC CULs.
Treatment Technology Design
As described in Section 12.3.3, soil washing uses particle size separation of soil fractions through aggressive contact with wash water that encourages PFAS to desorb from the soil phase into the water phase where treatment is more readily available through a closed-loop water treatment system. Unlike many destructive soil treatment technologies that have high energy/electricity demands, soil washing is a very effective and efficient solution to bulk treatment, providing an opportunity for full-scale implementation at a high throughput to significantly reduce the volume requiring further treatment. Washed soils meeting the CULs can be beneficially reused on-site, while the reduced volume not meeting CULs after the first wash can be rewashed to meet CULs, disposed off-site, or treated through subsequent destructive treatment technologies. In the end, the vast reduction in PFAS-impacted soil quantities that remain after soil washing makes destructive soil treatment technologies that will eliminate off-site disposal more viable. For this case study, water from a nearby surface water body was used (with no amendments) as the wash fluid.
Soil Characteristics
In 2021, the stockpiled soils were characterized to determine in-place volume (bank cu yds), bulk density, gradation, total organic carbon (TOC), and bulk concentrations of PFAS and co-contaminants. The stockpiles processed via soil washing in 2023 and 2024 were labeled EIE365-1, EIE378-4, EIE405-1, EIE405-2, and EIE-405-3 and consisted primarily of silty sand with gravel or silty gravel with sand. Particle size distribution and TOC concentrations for the four stockpiles are presented in Table 15-2-8 and initial bulk soil concentrations of PFAS and co-contaminants are presented in Table 15-2-9 and Table 15-2-10, respectively (USACE 2021).
| Stockpile | % Gravel | % Sands | % Fines | Density (ton/cu yd) | TOC (mg/kg) | |||
|---|---|---|---|---|---|---|---|---|
| Coarse | Fine | Coarse | Medium | Fine | Silt | |||
| EIE365-1 | 17 | 31 | 7 | 7 | 26 | 12 | – | 9,950 |
| EIE378-4 | 9 | 31 | 7 | 7 | 31 | 15 | 1.26 | 3,200 |
| EIE405-1 | 11 | 29 | 15 | 15 | 20 | 10 | 1.28 | 6,400 |
| EIE405-2 | 20 | 30 | 6 | 5 | 19 | 16 | 1.65 | 6,600 |
| EIE405-3 | 27 | 28 | 6 | 5 | 18 | 16 | 1.79 | 2,600 |
Notes:
1As reported in the Stockpile Characterization Report (USACE 2021)
“-“—not analyzed
cu yd—cubic yard
mg/kg—milligrams per kilogram
TOC—total organic carbon
| Stockpile | PFOA (µg/kg) | PFOS (µg/kg) |
|---|---|---|
| AK DEC CUL2 | 1.7 | 3 |
| EIE365-1 | 0.915 | 7.88 |
| EIE378-4 | 0.71 | 19.04 |
| EIE405-1 | 0.66 | 29.26 |
| EIE405-2 | 3.5 | 7.5 |
| EIE405-3 | 0.93 | 31.50 |
Notes:
RED—concentration exceeds the AK DEC CUL
1The pretreatment bulk soil result is the highest 95% UCL among decision units (DUs) for each stockpile as reported in the Stockpile Characterization Report (USACE 2021)
2CULs are from 18 AAC 75.341, Table B1 Method Two—Soil Cleanup Levels (AK DEC 2023)
AK DEC—Alaska Department of Environmental Conservation
CUL—cleanup level
| Stockpile Group | POL | Pesticides | PAHS | |||
|---|---|---|---|---|---|---|
| DRO | 4,4’-DDD | beta-BHC | Naphthalene | Benzo(a)anthracene | Benzo(a)pyrene | |
| AK DEC CUL2 | 250,000 | 98 | 10 | 38 | 700 | 1,500 |
| EIE365-1 | N/A | N/A | N/A | 34.5 | 479.4 | 485.9 |
| EIE378-4 | N/A | N/A | N/A | 49.4 | 1,644 | 1,405 |
| EIE405-1 | 45.92 | N/A | N/A | 140.5 | 2,057 | 1,614 |
| EIE405-2 | 772,200 | 29 | N/A | 31 | 306 | 290 |
| EIE405-3 | 49.37 | 180 | N/A | 40 | 370 | 350 |
Notes:
RED—concentration exceeds the AK DEC CUL
1The pretreatment bulk soil result is the highest 95% UCL among decision units (DUs) for each stockpile as reported in the Stockpile Characterization Report (USACE 2021)
2CULs are from 18 AAC 75.341, Table B1 Method Two—Soil Cleanup Levels (AK DEC 2023)
AK DEC—Alaska Department of Environmental Conservation
BHC—hexachlorocyclohexane
CUL—cleanup level
DRO—diesel range organics
N/A—not applicable
PAH—polycyclic aromatic hydrocarbon
POL—petroleum, oil, and lubricants
System Performance
During the 2023 and 2024 operational seasons (approximately 6 months of cumulative soil washing operations due to the winter conditions in Alaska) 32,431 loose cu yds of impacted soils (soils containing PFAS, diesel range organics ([DRO], polycyclic aromatic hydrocarbons [PAHs], and pesticides) were processed through the soil washing plant (Table 15-2-11). The effectiveness and quality of data for treatment were verified through 43 incremental sampling methodology soil samples (500 cu yd decision units [DUs], 30 soil increments per DU), 16 field triplicate incremental sampling methodology soil samples, 6 pretreatment discrete soil samples, 3 field duplicate pretreatment discrete soil samples, 71 field blank samples, 4 process water samples, and 1 processed water field duplicate sample. It should be noted that, based on contract payment schedule and equipment used, measurements of soil entering the soil washing plant were recorded in volume (loose cu yds via 2 cu yd industry standard excavator bucket loads) and measurements of processed soil exiting the soil washing plant were recorded in weight (tons via calibrated loader scale).
| TASK/F35 Project | EIE405 | EIE365 | EIE378 | ||
|---|---|---|---|---|---|
| Associated Stockpile(s) | EIE405-3 | EIE405-1 | EIE405-2 | EIE365-1 | EIE378-4 |
| Preprocessed Volumes (cu yd) | 1,975 | 3,835 | 815 | 6,430 | 19,376 |
| TOTAL PREPROCESSED VOLUME (cu yd) | 32,431 | ||||
Notes:
cu yd—cubic yard
Through soil washing, 30,768 tons of oversize and coarse-grained fractions were treated to below AK DEC CULs, of which 5,219 tons were also below May 2024 U.S. Environmental Protection Agency (USEPA) residential soil Regional Screening Levels (RSLs) used at the time and were reused by the installation for backfill and winter road maintenance (Table 15-2-12). Of the 6,398 tons of postprocessed fines not meeting the AK DEC CULs, 266 tons were rewashed at the end of the 2024 operational season to evaluate the effectiveness and efficiency of a second wash; these materials were successfully treated to below AK DEC CULs. Therefore, approximately 6,132 tons of postprocessed fines remain on-site for second wash, disposal, or possible future consideration of treatment with a destructive technology. As such, soil washing was able to reduce the volume of PFAS-impacted soils by 83%, representing a total of 31,034 tons of soils meeting AK DEC CULs out of 37,166 tons of postprocessed soils. Table 15-2-13 and Table 15-2-14 summarize the PFAS and co-contaminant concentrations for the postprocessed coarse and fines fraction from the first DU for each stockpile. It should be noted that the elevated concentration of postprocessed fines during processing of EIE405-1 and EIE365-1 soils is not indicative of PFAS concentrating on the fines fraction but an ineffective operating procedure that was corrected during treatment of EIE378-4.
| Stockpile(s) | Oversize (tons) |
Coarse (tons) |
fines (tons) |
Total (tons) |
|---|---|---|---|---|
| EIE365-1 | 3,045 | 2,718 | 1,266 | 7,029 |
| EIE378-4 | 8,383 | 10,965 | 3,090 | 22,438 |
| EIE405-1 | 1,489 | 1,650 | 974 | 4,113 |
| EIE405-2 | 365 | 381 | 295 | 1,041 |
| EIE405-3 | 865 | 908 | 773 | 2,546 |
| TOTAL POSTPROCESSED WEIGHT (tons) | 14,146 | 16,622 | 6,398 | 37,166 |
| PFAS Analyte | PFOS | PFOA | PFBA | PFBS | PFNA | PFHxA | PFHxS | HFPO-DA | ||
|---|---|---|---|---|---|---|---|---|---|---|
| AK DEC CUL1 | 3 | 1.7 | NE | NE | NE | NE | NE | NE | ||
| USEPA RSL2 | 130 | 190 | NE | 1,900 | 190 | 3,200 | 1,300 | 230 | ||
| Oversize Fraction | ||||||||||
| 405-2 | 0.14 | 0.006 | ND [0.04] U | ND [0.08] U | 0.003 | ND [0.01] U | 0.03 | ND [0.02] U | ||
| 378-4 Rewash | 0.02 | 0.001 J+ | ND [0.01] U | ND [0.002] U | ND [0.002] U | ND [0.002] U | 0.002 J | ND [0.005] U | ||
| Coarse Fraction | ||||||||||
| EIE365-1 | 1.07 | 0.106 | ND [0.20] U | ND [0.04] U | 0.02 J | 0.04 J | 0.32 | ND [0.10] U | ||
| EIE378-4 | 0.54 | 0.027 J+ | ND [0.20] U | ND [0.04] U | ND [0.05] U | 0.04 J | 0.06 J | ND [0.05] U | ||
| EIE405-1 | 0.49 | 0.013 | ND [0.20] U | ND [0.04] U | ND [0.05] U | ND [0.05] U | 0.04 J | ND [0.10] U | ||
| EIE405-2 | 0.42 | 0.04 | ND [0.22] U | ND [0.05] U | 0.03 | ND [0.05] U | 0.1 | ND [(0.11] U | ||
| EIE405-3 | 1.33 | 0.020 | ND [0.20] U | ND [0.05] U | 0.02 [0.05] J | ND [0.05] U | 0.08 J | ND [0.10] U | ||
| Fines Fraction | ||||||||||
| EIE365-1 | 8.73 | 0.263 | ND [0.21] U | 0.03 J | 0.09 J+ | 0.09 J | 0.96 | ND [0.11] U | ||
| EIE378-4 | 9.87 | 0.116 J | ND [0.23] U | ND [0.05] U | 0.04 J | 0.08 J | 0.48 | ND [0.12] U | ||
| EIE378-4 Rewash | 2.77 | 0.042 J+ | ND [0.21] U | ND [0.05] U | ND [0.05] U | 0.03 J | 0.19 | ND [0.11] U | ||
| EIE405-1 | 22.6 | 0.108 | ND [0.20] U | 0.03 J | 0.06 J | 0.08 J | 1.03 | ND [0.10] U | ||
| EIE405-2 | 5.19 | 0.09 | ND [0.22] U | ND [0.05] U | 0.06 | 0.04 | 0.47 | ND [(0.11] U | ||
| EIE405-3 | 11.7 | 0.067 J+ | ND [0.20] U | ND [0.05] U | 0.07 J | 0.05 J | 0.37 | ND [0.10] U | ||
Notes:
All concentrations presented are in micrograms per kilogram (µg/kg)
RED—concentration exceeds the AK DEC CUL
1 CULs are from 18 AAC 75.341, Table B1 Method Two—Soil Cleanup Levels (AK DEC 2023)
2 USEPA RSL for residential soil with a hazard quotient of 1.0 and cancer risk of 1×10⁻⁶ (USEPA 2023)
Limit of detection shown in brackets [ ]
| AAC—Alaska Administrative Code AK DEC—Alaska Department of Environmental Conservation DL—detection limit USEPA—U.S. Environmental Protection Agency HFPO-DA—hexafluoropropylene oxide dimer acid J—the result is an estimated value greater than or equal to the DL and less than the LOQ J+—the result is an estimated quantity, but the result may be biased high LOQ—limit of quantitation NE—not established |
PFAS—per- and polyfluoroalkyl substances PFOA—perfluorooctanoic acid PFOS—perfluorooctanesulfonic acid PFBA—perfluorobutanoic acid PFBS—perfluorobutanesulfonic acid PFNA—perfluorononanoic acid PFHxA—perfluorohexanoic acid PFHxS—perfluorohexanoic acid RSL—Regional Screening Level U—the analyte was not detected and was reported as less than the LOD |
| Analyte Category | POL | Pesticides | PAHs | |||
|---|---|---|---|---|---|---|
| Analyte | DRO | 4,4’-DDD | beta-BHC | Naphthalene | Benzo(a)anthracene | Benzo(a)pyrene |
| AK DEC CUL1 | 250,000 | 98 | 10 | 38 | 700 | 1,500 |
| Coarse Fraction | ||||||
| EIE365-1 | N/A | N/A | N/A | N/A | N/A | N/A |
| EIE378-4 | N/A | N/A | N/A | ND [9.99] U | 111 | 95.4 |
| EIE405-1 | N/A | N/A | N/A | ND [3.47] U | 8.36 | 7.87 B |
| EIE405-2 | 16.40 | 0.015 | ND [4.30] U | ND [47.6] U | 0.06 | 0.10 |
| EIE405-3 | 17,900 | 3.94 | ND [1.33] U | ND [10.0] U | 131 | 160 |
| Fines Fraction | ||||||
| EIE365-1 | N/A | N/A | N/A | N/A | N/A | N/A |
| EIE378-4 | N/A | N/A | N/A | ND [11.8] U | 532 | 487 |
| EIE405-1 | N/A | N/A | N/A | ND [10.1] U | 22.1 | 23.7 |
| EIE405-2 | ND [5,270] U | 152 | ND [4.22] U | ND [50.6] U | 54.6 | 78.9 |
| EIE405-3 | 64.5 | 10.2 | ND [1.35] UJ | ND [20.2] U | 81.0 | 102 |
Notes:
All concentrations presented are in micrograms per kilogram (µg/kg)
RED—concentration exceeds the AK DEC CUL
Bold—nondetect is reported at less than the DL, which is higher than the AK DEC CUL
1 CULs are from 18 AAC 75.341, Table B1 Method Two—Soil Cleanup Levels (AK DEC 2023)
LOD shown in brackets [ ]
| AAC—Alaska Administrative Code AK DEC—Alaska Department of Environmental Conservation BHC—hexachlorocyclohexane DDD—dichlorodiphenyldichloroethane DL—detection limit DRO—diesel range organics CUL—cleanup level EB—equipment blank USEPA—U.S. Environmental Protection Agency J—the result is an estimated value greater than or equal to the DL and less than the LOQ |
LOD—limit of detection LOQ—limit of quantitation N/A—not applicable ND—not detected PAH—polycyclic aromatic hydrocarbon POL—petroleum, oil, and lubricants U—the analyte was not detected and was reported as less than the DL |
In addition to soil, 314 one-cu-yd sacks of vegetation were also generated as a result of soil washing operations and are being temporarily stockpiled on-site until waste characterization is complete, and disposition options are finalized.
The capacity of wash water in the soil washing plant is approximately 71,500 gallons, which is circulated in a closed loop through the soil washing plant for soil processing and treated through a water treatment plant consisting of two trains of pretreatment sand media, lead-lag granular activated carbon vessels, and lead-lag ion exchange resin vessels. During soil washing operations, this water capacity is circulated 20 times through the soil washing plant per day, resulting in the equivalent of approximately 1.4 million gallons of water per day processed through the water treatment system. Treatment system media is backwashed several times per day. Over the course of the operating season, a total of 86,000 gallons of process water was used (additional water was necessary above 71,500 gallons of the plant capacity due to evaporation and accumulated water content in postprocessed materials). PFAS and co-contaminants of concern were treated to less than their respective AK DEC CULs and discharged on-site.
This project is ongoing with opportunities for process optimization to reduce the volume requiring rewash or disposal off-site, or both. Destructive technologies are also being considered for incorporation into the project, resulting in a complete treatment train that will provide a total on-site treatment and management solution.
Costs
The cost to implement soil washing is based on two main factors: 1) the total amount of soil to be processed and 2) the percentage of fines in the soil. The less soil to be treated and the higher the percentage of fines, the higher the unit cost. This is because mobilization/demobilization of labor and equipment does not vary substantially, as the same equipment and labor is needed regardless of the amount of soils to be treated on-site. Additionally, as the percentage of fines increases, treatment throughput decreases. Based on experience, the cost of soil washing can range between $350 and $650 per ton and is inclusive of management, planning/reporting, mobilization/demobilization, equipment, labor, laboratory analysis, power, and waste management (for example, disposal of postprocessed fines not meeting AK DEC CULs and spent water treatment media). These costs are competitive when compared to off-site disposal, especially in more remote project locations such as parts of Alaska.
For example, the cost of off-site disposal for this project was estimated to be almost $500 per ton just for labor and materials for loading, transportation, and disposal of PFAS-impacted soils via rail from the project location in Alaska to a Subtitle D landfill with leachate collection system in Oregon. This off-site disposal unit price does not include management, laboratory analysis and waste profiling, and reporting. Therefore, the cost per unit for soil washing provided above is very competitive. Additionally, soil washing minimizes generator risk by significantly reducing (in this case by 83%) the amount of PFAS-impacted soils requiring off-site transport and disposal to a long-term managed land application out of state. This risk is exacerbated by the ever-changing regulatory atmosphere surrounding PFAS, which is only expected to require more PFAS-impacted soils to be managed with disposal costs likely increasing over time.
15.3 Risk Assessment Case Study (2020)
The New Jersey Department of Environmental Protection (NJDEP) Division of Science, Research, and Environmental Health conducted an initial assessment of PFAS impacts at a select group of surface water bodies in New Jersey (NJDEP 2018) (Figure 15-20). The results of fish tissue sampling from each site were used in a risk assessment methodology to determine the need for fish consumption advisories for PFAS in each of those water bodies.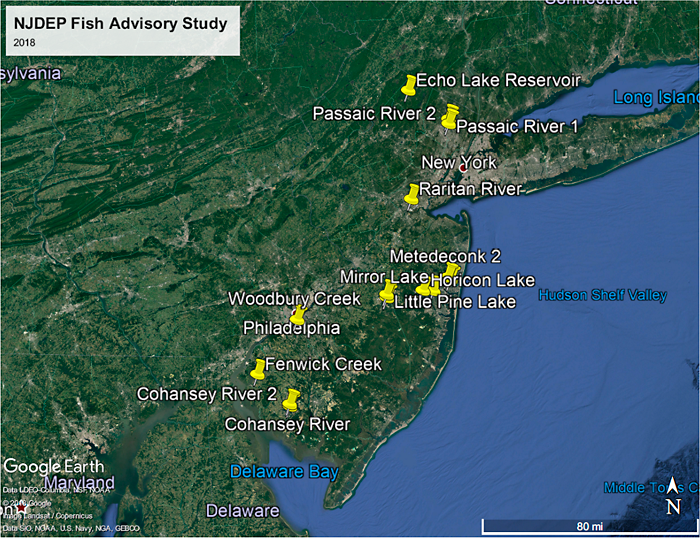
Figure 15-20. Map of water bodies included in NJDEP fish tissue study.
Overall, fish tissue samples from up to 12 different species were collected from 11 specific water bodies throughout the state. The water bodies were selected for sampling based upon their location relative to possible PFAS sources and the likelihood that they could be used for recreational fishing. Samples were analyzed for 13 PFAS (PFBA, PFPeA, PFHxA, PFHpA, PFOA, PFNA, PFDA, PFUnA, PFDoA, PFBS, PFHxS, PFOS, and PFOSA), and as presented in Figure 15-21, the results indicated that the predominant PFAS detected in the fish tissues was PFOS.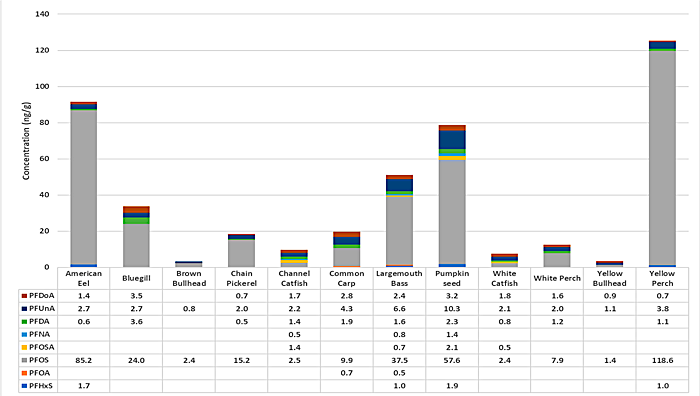
Figure 15-21. Fish tissue sampling results. Average concentration detected per species.
Data from NJDEP (2018).
Using the noncancer oral reference doses (RfDs) New Jersey Department of Environmental Protection derived for PFOA [2 ng/kg-day; (NJDWQI 2017)], PFOS [1.8 ng/kg-day; (NJDWQI, 2018)], and PFNA [0.74 ng/kg-day; (NJDWQI 2015)], and generic conservative assumptions regarding fish consumption exposure, NJDEP derived risk-based advisory triggers for each of these compounds based upon different fish consumption frequencies specifically, once/day, once/week, once/month, once/3 months, once/year.
The following equation was used to derive their risk-based triggers (which are presented in Figure 15-22):

where
– Cfish is the risk-based fish concentration (ng/g)
– HQ is the target hazard quotient = 1 (unitless)
– M is the number of meals during the exposure period
– CR is the fish consumption rate (g/meal) = 8 oz/meal (227 gram/meal)
– BW is the body weight (kg) = 70 kg
– RfD is the chemical-specific oral reference dose (ng/kg-day)
– ATnc is the noncancer averaging time (days)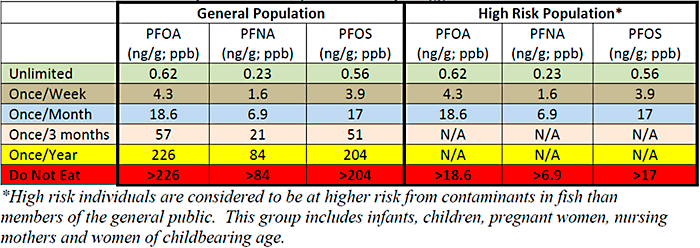
Figure 15-22. Risk-based fish advisory triggers.
Data from NJDEP (2018).
Because of concerns associated with the potential developmental health effects associated with these chemicals and given a lack of acute toxicity values for these compounds, NJDEP did not recommend advisory levels for the once/3 months and once/year exposure frequencies for high risj populations (young children, pregnant and lactating women, women of childbearing age), and the once/month value is the least frequent consumption category recommended for these high risk populations.
A comparison of the derived risk-based advisory levels with the measured concentrations in fish tissue samples from each of these waterways resulted in NJDEP recommending the following fish consumption advisories for the general population (Figure 15-23).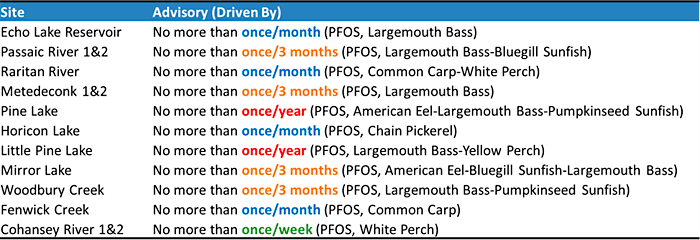
Figure 15-23. NJDEP fish advisories for general population.
Data from NJDEP (2018).
15.4 Risk Communication Case Studies
15.4.1 Little Hocking Water Association (LHWA), Ohio (2020)
The communication and community participation strategy used for residents served by the Little Hocking Water Association (LHWA) in southwest Ohio produced effective results in motivating actions by individuals, government, and industry which led to a significant, measurable reduction in residents’ blood PFOA levels.
A community-first strategy was implemented at the Little Hocking, Ohio, site to effectively communicate scientific results and findings in a manner that embodies the principles of community-based participatory research (CBPR). This type of strategy combines scientific methodology with community capacity-building strategies to address the disparities and power imbalances among stakeholder groups (business owners, residents, regulatory, and responsible party). If properly implemented, CBPR can result in trust rebuilding, management of environmental justice matters, empowerment to those affected by providing information for informed action, and improved research and data collection (Viswanathan et al. 2004; Hartwig, Calleson, and Williams 2006; O’Fallon, Tyson, and Dearry 2000; Executive Order 12898 1994). The following is a case study summary of the Little Hocking, Ohio, site (Emmett et al. 2006; Emmett et al. 2009; Emmett and Desai 2010).
15.4.1.1 Site Description
The LHWA is a rural water authority that serves several small communities with a total population of approximately 12,000 residents in 4,000 households. The reticulation system extends around 25 miles into Ohio from Little Hocking, a small rural community along the Ohio River in Washington County, Appalachian Ohio. Based on the 2010 U.S. Census, the total population of Little Hocking was 263, predominately Caucasian, majority between the ages of 18–64 years, and 21.5% of individuals live below the poverty level. The water intake wells for the LHWA are located directly across the Ohio River from a Teflon production plant that used ammonium perfluorooctanoate (APFO, the ammonium salt of PFOA). This plant was physically located in West Virginia; therefore, the enforcement and regulation of the plant and its emissions fell to the West Virginia agencies.
Since the 1950, the plant was known to historically release APFO into the air and water and to dispose of byproducts containing APFO in local landfills (WV DEP 2002). APFO readily converts to its anionic form, PFOA, in the environment. When tested in 2001 and 2002, the LHWA source wells had levels ranging from 0.855 ppb to 7.69 ppb. Community concerns were raised because PFOA detections in the water supply were considerably higher than any reported PWS in the United States at the time. Prior to the study summarized here, there was no information about the sources of PFOA that was being detected in human blood in widespread locations. In the absence of this information, the West Virginia Department of Environmental Protection convened the C-8 Assessment of Toxicity Team, and developed a health protective screening level for water at 150 ppb. In addition, an interim action level of 14 ppb was established by a USEPA Consent Order with the responsible party. In August 2002, groundwater borings advanced in the LHWA well field contained PFOA concentrations up to 78 ppb. A class action suit was initiated, and distrust increased among the affected community and both the government and responsible party.
To investigate community concerns about potential PFOA contamination of residents in the LHWA district, a partnership was formed between the University of Pennsylvania School of Medicine, a local health provider, and the Decatur Community Association, made up of residents living within the LHWA district. The partnership obtained an environmental justice research grant from the National Institute of Environmental Health Sciences. The research was designed to engage the affected community on all aspects of the study to determine (1) whether blood PFOA levels were elevated in the community, compared with Philadelphia residents and with published population values; (2) if blood PFOA levels were elevated, was the source air, water, or some other combination of exposures; and (3) if levels were elevated, were there changes in certain biomarkers of potential toxic effects.
A community advisory committee (CAC) was formed with local residents served by the water supply, local physicians, state and federal government representatives, a health researcher, and a school system representative. A community project coordinator was employed as a communication enabler. The CAC met quarterly and all meetings were open to the public with the only participation restrictions being that the attorneys and plant representatives were not permitted to take part in the discussions. Community advice was particularly sought as to which scientific questions to address, development and wording of questionnaires, communications with residents, and citizen concerns. The CAC utilized newsletters to keep local residents and other stakeholders informed. These newsletters and CAC meeting minutes were posted on a CAC study website.
The study team collected blood serum PFOA, hematologic and biochemical biomarkers, a questionnaire to obtain information on demographic and occupational information, and health conditions from a stratified random sample of residents in the LHWA reticulation area. The median blood PFOA levels for residents were approximately 80 times those of the general population and similar to levels reported for production workers at the fluoropolymer facility. PFOA levels were higher in children and the elderly. Residents using LHWA water who worked in production areas of the plant had PFOA levels that reflected additive effects from both exposure pathways. Residents who primarily used well water for domestic purposes had PFOA levels that correlated with the PFOA concentration in well water. No impact was seen from living in areas with higher estimated air levels.
15.4.1.2 Community-First Communication Strategy
After data had been collected from participants, but before any results were available, the CAC discussed and developed a communication strategy. For this purpose, the CAC developed a set of general principles for communication and a list of priority targets representing the community’s preferred order for communication of results:
LHWA Residents’ General Principles for Communications, from Emmett and Desai (2010) and Emmett et al. (2009).
- Results should be released promptly, but not before the investigators are comfortable in doing so.
- Individual participants should receive their results first to avoid participants first learning study results from the press, neighbors, or friends.
- The press should be informed in a manner that is both timely and allows the investigators to control the message as much as possible.
- The study must remain a credible source of information.
- Communications should maximize constructive responses to the findings.
- Communications should minimize pointless concern.
- Questions from individuals should be answered promptly.
LHWA District Residents’ List of Priority Targets for Communication of Results, from Emmett et al. (2009).
- study participants and community (residents of the water district)
- community advisory committee
- relevant authorities and representatives (county and state health departments, state Department of Environmental Protection, local water authorities, state and federal elected government representatives for the area, local townships, sheriffs’ departments, USEPA)
- local medical providers
- local media
- national media, as necessary.
Once the general principles of engagement were established, the CAC developed a communication strategy and plan. The CAC determined that the strategy required multiple modes of engagement that enforced consistent simple messages and consideration of careful timing to mitigate development of inaccurate perception of risk and management strategies. The communication plan was a “living document” to facilitate continued integration of stakeholder input, regulatory development, and scientific advancement. The sequence of communications commenced with mailings to participants at the end of July 2005 and culminated in a community meeting on August 15, 2005, where full results were presented.
15.4.1.3 Results and Use of Risk Communication Tools
- Notifications to Participants and Authorities—Biomonitoring results were sent via next-day-delivery mailings to individual study participants. These results included the individual’s blood PFOA and biomarker levels as well as comparative information on PFOA levels (including blood levels for national and site facility workers, general US population, and community neighborhoods) and a toll-free telephone number to contact a study physician with any questions. Letters containing aggregated, not individual, results were sent simultaneously to identified authorities and CAC members, to ensure that recipients would be able to respond appropriately to inquiries from the public.
- Lessons and Takeaways: Calls often needed to be returned after business hours. Most concerns focused on higher levels in children and the elderly, and possible interactions of elevated PFOA levels and particular medical conditions.
- Initial Press Release and Briefing—Key local and regional media were identified and informed of the communication plan around the date the participant letters were sent. An initial press release and briefing were made the second day after the results were mailed to ensure that participants did not first learn of the issue through the press, while still providing investigators an opportunity to be the primary source of information to the press. Identified media representatives and national news outlets were invited to the news briefing. The release simply identified that levels in LHWA residents were much higher than those in the general US population, and that water had been identified as the major source of exposure. Interested stakeholders were urged to attend a community meeting where comprehensive results would be released and discussed.
- Lessons and Takeaways: The reporting by local and national media did not misconstrue information and local media participated as per the communication plan. The CAC perceived the media coverage as constructive. The community expressed great satisfaction that participants had received their results first.
- Closed Rehearsal of Community Presentation—A full closed-door rehearsal presentation (summarized in the subsequent bullet) was presented by the study team to the CAC prior to the community meeting. The closed rehearsal ensured that the community meeting presentation was as inclusive and useful as possible.
- Lessons and Take-Away: The CAC requested a presentation that was careful and simple to understand, incorporating a clear visual map so that residents could locate their residences with respect to the study results. During rehearsal, the CAC members provided feedback on the order of the agenda, comprehensibility of slides, choice of wordings to accord with terminology and usage in the area, structure of the presentation, and dealing with likely questions.
- Community Meeting—The meeting commenced with “ground rules,” such as lawyers were not to solicit clients and questions were to follow the presentation. It was also communicated that continual stakeholder feedback is a success factor of the communication plan. In addition, representatives from the facility were invited to attend but were not permitted to present. The 45-minute presentation given by the study team detailed partnership objectives and study methods, results, and recommendations. A two-hour question and answer period followed the presentation. A summary of the study, recommendations (including the use of bottled water), sources of information, and how to access a study physician were distributed to all attendees on exit. The meeting summary and information on accessing free bottled water were mailed to households in the LHWA district and local authorities and representatives.
- Lessons and Takeaways: The meeting proceeded in a constructive manner as CAC community members had predicted and not in the angry manner outside public relations experts had predicted. Any anger was directed at the responsible party and not at the investigators.
- Publication of Results and Information—Following the community meeting, a newsletter with test result summaries was issued. A website with meeting presentation slides, test results, and FAQs was also developed. A summary of results was sent to all LHWA district residents.
- Lessons and Takeaways: The website received many hits. The study and recommendations did not prove controversial. The practitioners did not encounter antagonistic relationships between the different parties.
- Availability to Answer Questions—Physicians from the study team made themselves available to the public to answer questions from individuals and also from treating health care professionals.
- Lessons and Takeaways: This service was appreciated. Questions mostly focused on the impact on residents with particular conditions such as liver and kidney disease. The many uncertainties surrounding the risk to humans were openly acknowledged.
15.4.1.4 Effectiveness of Communications
On the day results were presented and approximately 2 weeks after the initial press release, the responsible party announced that it would make free bottled water available to LHWA district residents (3 liters per day per person). Seventy-eight percent of eligible households accepted the offer.
Sixteen months after dissemination of the study results, a follow-up study of participants was made, which included repeat blood PFOA levels and questions about any changes in water usage. Sixty-five percent of those in the initial study participated in the follow-up, of whom 95 percent had made some change in their residential water usage in a way that would be expected to reduce PFOA intake. Eighty-eight percent had followed study recommendations to switch to using bottled water. The group median blood PFOA had declined 26%, consistent with a large effect for a pollutant with a half-life of approximately 4 years in humans.
USEPA used the results to enter into a consent agreement with DuPont to provide bottled water for the other impacted communities near the plant with >0.5 ppb of PFOA in water, and the states of Minnesota and New Jersey set provisional standards for PFOA levels in drinking water.
Lessons and Takeaways: The results and communications strategy resulted in 95% of participants had made a change to their water source. This response greatly exceeds the usual level of response seen with public health interventions. All parties, individuals, corporations, and governments acted in a prudent way with the disseminated information. Not all residents reacted by adopting the specific recommendations from the study; the alternate actions some individuals took are consistent with the information being incorporated into individuals’ own risk perceptions and with the development of a free market of solutions (individual decision making based on available information).
15.4.1.5 Case Study Summary
The Little Hocking Community-First Communication Strategy resulted in a great increase in alternate water source use by impacted community members and subsequently, a reduction in community PFOA blood levels. The success of the communication plan at the Little Hocking site was underlain by the four dimensions of risk communication:
- Understanding: Investigators worked with the community through the CAC to establish the communities’ preferences and priorities in the form of a communication strategy and plan to maintain simplified and consistent messaging among stakeholder groups and interested parties, such as the media.
- Perception: Risk perception factors were incorporated into the outreach strategy, including residents’ knowledge of PFOA biomonitoring results and associated illnesses, ability to access a physician, presence of vulnerable subpopulations (higher PFOA levels in children and the elderly), proximity of individual residences to elevated concentrations within the study area (sense of a safe place), and possible interactions of elevated PFOA levels and particular medical conditions.
- Participation: The affected community actively participated in all components of the communications.
- Evaluation: Success and effectiveness of the communication process were assessed based on feedback from the CAC, surveys of residents, and review of newspaper articles and other media content. In addition, a follow-up study was performed that addressed the effectiveness in terms of lowered blood levels of PFOA and a questionnaire about whether and how community members had changed their drinking water source as a result of the risk communication strategy.
15.4.2 State-Led Community Involvement Case Studies (2020)
The Environmental Council of the States (ECOS), in collaboration with the USEPA Office of Research and Development and the Association of State and Territorial Health Professionals, has developed a series of case studies presenting how state regulatory agencies are performing risk communication to PFAS-impacted stakeholders: https://www.ecos.org/documents/state-level-risk-communication-of-pfas-and-habs/
15.4.3 Washington County, MN: A State’s Approach to Risk Communication (2020)
Washington County is home to 3M’s Cottage Grove manufacturing facility as well as several disposal facilities where PFAS had been routinely disposed. Beginning in 2002, the State of Minnesota pursued drinking water investigations at the 3M facility and later near 3M’s waste disposal sites in Washington County. According to the 2010 US Census, the population of Washington County, Minnesota was about 238,136, with the majority being Caucasian and between the ages of 18 and 64. Over 1,800 private wells, four major aquifers, eight municipal water supply systems, and over 150 square miles of groundwater were affected by the contamination. This impacted the drinking water supply of over 140,000 residents. After they were determined as the responsible party, 3M remained involved in the remediation efforts and paid for the majority of sampling throughout the county in coordination with MPCA.
This case study is discussed in the context of the risk communication plan.
15.4.3.1 Identify the Issue
The most widespread PFAS compound found in the region is PFBA. Additional prominent compounds include PFOS, PFOA, PFHxS. PFPeA, PFHxA, and PFBS which were always present as a mixture. When investigations began in 2002, there were many challenges to determining the impact for people as the science was in the very beginning stages of development. Therefore, MDH developed health-based guidance for PFOA and PFOS and the MDH lab developed the method to analyze water sample for PFOA and PFOS. As the science has progressed, MDH continues to update methods and health-based guidance.
Site communications are organized and performed in collaboration primarily between the Minnesota Department of Health and the Minnesota Pollution Control agencies. However, as with other PFAS sites, the site covers multiple local, county and state entities. Communications frequently entail only one or a few cities rather than the entire site. They may also need to be coordinated through all the cities and the county. This leads to multiple plans with multiple partners that are specific to an issue or communications plans developed for a specific project. The fundamental traits of successful risk communication over time and with all stakeholders for MDH include: empathy, care, competence, expertise, honesty, dedication, and commitment.
15.4.3.2 Set Goals
General communication goals and objectives for the site:
- Goal: Inform people about potential hazards to their person, property, or community and help them to make informed decisions about risks to their health.
- Objective: Develop approved message blocks for PFAS topics and house in accessible format to encourage consistent information is used for all materials developed.
- Objective: Provide regular updates about remediation activities at stakeholder group meetings including agency PFAS training meetings, county workgroup meetings, city council meetings and public meetings
- Objective: Provide regular updates about health risks as scientific information changes/evolves at stakeholder group meetings including agency PFAS training meetings, county workgroup meetings, city council meetings and public meetings
- Goal: Encourage people to take precautions to reduce exposure to PFAS
- Objective: Homes with contaminated drinking water are issued drinking water advisories and either connected to the city water or supplied with GAC filters that are maintained by the state.
- Objective: Keep updated information about actions people can take to lower their exposure to PFAS on MDH website and MPCA website.
- Objective: Mobilize stakeholder groups in the county or local communities to encourage people in their area to participate in remediation activities and processes offered by MPCA and contractors.
- Goal: Provide background information and present risks in an understandable way, using plain-language messaging.
- Objective: Provide opportunities for people impacted by contamination to connect with appropriate staff to find information and to ask questions if concerned.
- Objective: User test materials using MDH Plain Language Workgroup
- Goal: Bring new information as soon as available to build trust
Objective: Provide public meetings with open house sessions before and after a main presentation to bring new information to community
Objective: Provide availability sessions to encourage concerned people impacted by changes to learn more about their individual situations.
Project specific communications goals example:
Since 2002, there have been multiple changes in PFAS health based values provided by MDH, analytical advances which have impacted lab results, an investigation that looked at PFAS in garden produce and dust, multiple biomonitoring studies, fish monitoring and consumption guidance, drinking water and source water investigations, and a study to test point-of-use water treatment devices. All of these projects and scientific advances have resulted in specific communications to affected communities with goals and objectives tailored to the issue or project.
15.4.3.3 Identify Communities and Constraints
MDH catered their risk communication strategy to the following:
- Residents of affected communities
- Local governments: cities, townships, and their staff of varying sizes
- Washington County public health and environmental staff
- Legislators
- Other state agencies including MPCA
Constraints include the size of the area and the multiple local governments. The character of each township and city vary widely with different capacities to manage local information dissemination to affected residents. This requires communicators to develop relationships with each stakeholder group. The risks and impacts of PFAS contamination are managed differently for those on public water and private wells. Therefore, the correct information needs to be available in many different forms for different stakeholders.
15.4.3.4 Community and Stakeholder Assessment
Minnesota’s risk communication strategy in response to the Washington County PFAS drinking water contamination has been centered around community engagement and forging strong relationships with community members. Building these relationships enabled them to build trust with the community and develop new communication channels.
The Minnesota Department of Health (MDH), in conjunction with the Minnesota Pollution Control Agency (MPCA), maintains a hands-on risk communication approach. Information about community needs for information is gathered through regular update meetings with stakeholder groups and local government leaders. Public meetings, availability sessions and face to face interactions with community members during remediation activities provides a base of information for the ongoing communication efforts. MDH also maintains a 24/7 email and phone line for people to access with concerns or for information about site activities.
Minnesota had been engaging directly with affected communities since 2002. Having had a long-standing relationship with affected communities, MDH has a history of responding to the specific needs of the affected communities and has tailored its messaging to their knowledge level. Although basic information about PFAS is always available, the general level of knowledge amongst key stakeholders is high. For this reason and with these communities, MDH representatives lead with high-level information, as the attendees to the public meetings typically are interested in specific updates as opposed to rudimentary background information.
15.4.3.5 Identify Messages
MDH maintains a message block document with approved message blocks about a variety of topics for internal staff use. This document serves as the basis for specific information sheets developed for different stakeholder activities. It is also a resource to answer questions from concerned community members. Topics include health risk of PFAS, MDH guidance value information, current site activities, exposure information, fish consumption guidance, swimming, cumulative health risk, breastfeeding and health risks, PFAS and links to health problems, testing blood for PFAS, biomonitoring information, gardening and PFAS, and results of MN Cancer Surveillance System reports.
MDH notes the importance of discussing the scientific method with stakeholders to remain transparent about their course of action. They also share new knowledge as it becomes available and do not wait until they have a perfect message or until they know all of the facts to engage with the community. In an effort to uphold their principle of transparency, MDH acknowledges points of uncertainty and are clear about what they do not know when communicating with the public.
The messages are presented in different ways to different communities depending on the level of understanding that a community has about PFAS. For example, we had several meetings in 2018 for communities. One meeting was to a community which had not had PFAS contamination issues until 2018. The information for this community was presented in more of an elementary, broad overview style and level. Another presentation in the same month was to a neighboring community that had been involved with PFAS contamination since 2002. The presentation focused more on what the new information was rather than PFAS basics as the community had a more developed understanding of PFAS.
Examples of specific messages:
- Testing is available for households on private wells that would like their drinking water tested for PFAS. If test results show elevated levels, options are available from the MPCA for treating the water and reducing exposures.
- Currently, PFAS levels found in the drinking water supply in impacted communities have been within the margin of safety for the current drinking water guidance values, and outright negative health effects from these exposures are not expected with what is currently known about PFAS exposures and health effects.
- Affected water supplies are safe to use to water produce in home gardens.
- Biomonitoring Data Shows Interventions are working
Figure 15-24 includes biomonitoring data for three PFAS compounds over the time period from 2008 to 2012. This study shows that although we can’t answer questions about health effects, we can demonstrate the work we are doing to reduce exposures has paid off.
Figure 15-24. Biomonitoring Data
Source: Courtesy of the Minnesota Department of Health
- Because of the extreme persistence and mobility of these compounds, a PFAS megaplume developed which is much larger than early modeling predicted. One of the primary factors in this was the unanticipated transport of PFAS via surface water and then re-infiltration to groundwater far away from the source areas – a transport pathway not typically seen in persistent environmental contaminants, which tend to adsorb to organic carbon in soils and sediments.
15.4.3.6 Select Communication and Engagement Tools
MDH’s risk communication strategy facilitates community engagement and open dialogue.
- Engaging with stakeholders and communities as soon as possible when there is any change in risk management of PFAS. Builds trust over time that MDH will be there to support and help communities.
- MDH sends the right people/experts/staff to deliver messages. Over time, staff have built relationships with stakeholders.
- When interacting with people impacted by the site, staff stays until all questions are answered – whether it is a phone call, a public meeting or availability session
- MDH has a service-oriented approach to community engagement. They recognize that educating the community members will carry a ripple effect. Attendees from the meetings who learn through the presentations and the open house format will then take the information and share it with other members of the community.
MDH used the following strategies to connect with and inform the affected communities:
- Hosting Public Meetings: Public meetings have been a significant part of community engagement in Washington County. MDH has held public meetings in an open house, presentation, and Q&A format. An open house is followed by a presentation given to the attendees, after which they provide a time for questions and answers, followed by additional open house time. Participants are able to ask questions about their particular situations in an open forum setting or in one-to-one conversations. For example, in Spring 2017, MDH in collaboration with MPCA held two presentations in different areas of Washington County. The city of Cottage Grove meeting attracted 130 people. In Lake Elmo, a region where the majority of residents have private wells, approximately 120 people attended the public meeting.
- Hosting Availability Sessions/Office Hours: MDH organized opportunities to provide people with time to interact with staff one on one and ask questions. Typically, MDH held these events after major sampling events happened or when new or updated information was released. MDH extended these opportunities upon request of the community. The events were widely used. In an event held in Fall 2017, the office hours held in Lake Elmo where the majority of residents have private wells attracted 45 people. With the affected area being so large, personal communication was helpful in establishing relationships with members of the community.
- Providing Online Resources: The MDH website outlined the history of PFAS in Minnesota as well as actions they have taken and health-based guidance information. An electronic online sampling request form was available on the MDH website. An electronic map on the website shows where MDH is sampling and community members could see and check their property’s location in relation to the PFAS contaminated sites. MDH also had a widely used email address for residents to ask questions directly to the department. They could also subscribe to the government’s delivery email list to get new information directly to their inbox.
- Communicating with Local Government: MDH prioritized communication with local government because it was a useful tool in keeping the communities informed. They visited city councils to provide updates on the PFAS investigations. They also provided technical support to local governments and their staff that were responsible for protecting public drinking water.
- Using the Media: MDH used press releases and interviews to disseminate information. Social media became a useful tool as well.
15.4.3.7 Implement Strategy
Strategies implemented included:
- Drinking Water Advisories: Over 2700 private wells have been sampled in the East Metro and over 1, 100 drinking water advisories have been issued. Homes that have been issued drinking water advisories are either connected to city water or provided bottled water and/or GAC filters maintained by the state. MDH and MPCA collaborated to communicate and coordinate action for this work.
- Public Water Systems: There are five community public water supplies in the East Metro that have individual wells above the MDH health-based guidance values. All of these cities put in place interim measures to manage their public water supply systems to provide drinking water at or below the MDH health-based guidance values. MDH collaborated with these communities to provide information to residents.
- Messages to Community: After developing health-based guidance values for PFAS compounds, MDH sought to explain to the community what these values mean and what concerns they address. They also explained the next steps in their action plan.
- Reiterating Commitment: MDH drives home the message that they are committed to bringing updated information to the communities to inform them of the status of their efforts. This assures the community that MDH is determined to support them and address their concerns.
- Collaboration with Other Stakeholders: MDH collaborated with MPCA on a response to the PFAS contamination. Any message that were released to the public by MDH was in conjunction with MPCA. ATSDR also developed a community engagement book which has guided MDH’s risk communication strategy. Additionally, MDH worked closely with city administrators and community leaders to keep them informed prior to the public meetings.
- Concessions: When drinking water levels were found to be above guidance values in private wells, bottled water was provided by MPCA until a GAC system can be installed.
15.4.3.8 Evaluate, Debrief and Follow Up
Continuous improvement of risk communications and activities through evaluation and through providing feedback loops with stakeholders supports the ongoing implementation strategies described above. The sampling and remediation activities have been widely successful in part due to the community engagement and communications efforts that have built trust in the community for the state agencies.
Evaluation methods used to understand effectiveness of communications content and process include one on one surveys at events, hot washes with partner agencies after communications efforts, and feedback from community leaders at regular update meetings.
Continuously improving, refining, and developing materials to meet community concerns and needs that are identified by inquiries or contacts staff have with community members. Contacts are primarily through 24/7 email and phone line as well as in person while in the field or at public events.
Materials have been developed in many formats over the years and have changed due to capacity for communities to use various methods and MDH capacity to produce them – video, face to face meetings, print, social media in coordination with partners. Investigations and other information have also resulted from community concerns. These include Cancer Incidence Reports, home and garden study, site-specific meal advice for fish consumption, point-of-use filter testing, clinician information sheet, and an information sheet about testing blood for PFAS.
15.4.3.9 Successful Outcomes
The Minnesota Department of Health has been very successful in community engagement:
- They have earned the trust of the community, and residents are assured that MDH is working hard to solve the issue at hand. The number of people participating in sampling and remediation speaks to the efforts made to connect with affected people. Exit surveys from public events have shown that people feel staff are working hard and are good at the work they do.
- MDH also has invested their resources in research and has made strides in understanding the health impacts of the PFAS contamination their state is facing. Many of the investigations and projects were in response to concerns collected through contacts with community members and leaders. These include Cancer Incidence Reports, home and garden study, site specific meal advice for fish consumption, point-of-use filter testing, clinician information sheet, and an information sheet about testing blood for PFAS.
- They have used biomonitoring to demonstrate that their efforts have reduced the PFAS levels in people’s bodies. This has provided the community with tangible evidence that the work they are doing is making a difference.
15.4.3.10 Lessons Learned
- It is vital to be on the ground and engage with the community face-to-face. This helps build trusting relationships with the community which has facilitated the remediation efforts and supported reducing exposures to PFAS for community members.
- The cross-agency effort to address the PFAS concerns in Minnesota is a challenge and takes effort to coordinate, but over time has been an effective strategy to address exposures to PFAS in a timely manner.
- Dealing with residential homes and homeowners can be complex. Because PFAS is a complex emerging contaminant for which research and information is constantly evolving, it can be a challenging to return to residents with new guidance values based on new health risks. The information has to fit for those who are familiar with PFAS and those who are new homeowners or residents in affected communities.
- It is important to learn what information residents are looking for and relay it in an articulate manner and in a way that is useful to them. Another concern Minnesota residents have had is a potential decline in property value, but this concern has faded with time.
- Additionally, it is important to be understanding and sympathetic toward the affected residents when they are upset. They are concerned for the well-being of their families.
15.4.3.11 Better Practices Moving Forward
Moving forward, MDH notes that sites across the state have similar circumstances and similar concerns. The lessons learned from sites they have already worked with have been beneficial in refining their approach with other affected communities and contaminants. They have had success with duplicating their strategies and methods at other sites. Although the general principles have been effective, every community is slightly different. MDH takes the time to understand the dynamics of each particular community and tailor their risk communication methods accordingly.
15.5 Surface Water Quality Case Studies
15.5.1 PFAS-Containing Foam (2023)
Case Study: Minnesota Project 1007 Feasibility Study (Contributed by Rebecca Higgins, MPCA)
15.5.1.1 Issue
The surfactant and micelle properties of per- and polyfluoroalkyl substances (PFAS) have proven to result in accumulation into foams on surface waters in many states. The observed foam has implications for exposure to people, aquatic life, wading and dabbling birds, and other wildlife. The concentrations of PFAS in these foams are documented to be thousands to millions of times higher than the concentrations in the water column.
15.5.1.2 Background
In May 2019, the Minnesota Department of Transportation (MNDOT) requested water sampling from the Minnesota Department of Health (MDH) within the area of a transit project in the East Metro of the Twin Cities Metropolitan Area (TCMA), potentially in an area of known PFAS contamination. In response, the MDH sampled surface water and foam above the surface water of Battle Creek located downstream from the area of interest for PFAS. At that time, analytical results indicated PFOS and PFOA impacts were present in the surface water at concentrations of 0.013 ppb and 0.017 ppb, respectively. Comparatively, PFOS and PFOA were present in the foam at 140,000 ppt and 11,000 ppt, respectively, indicating an enrichment compared to the paired surface water results.
In 2020, this occurrence of PFAS-containing foam led the Minnesota Pollution Control Agency (MPCA) to look for its presence as part of the Project 1007 Feasibility Study also in the East Metro under the 2018 3M settlement. Project 1007 conduit drains surface water across the northern portion of the east metropolitan area of the Twin Cities. Foam was noted on the surface of Raleigh Creek and in the corridor from the closed 3M Oakdale Disposal Site, and past the confluence of Raleigh Creek with the Project 1007 stormwater conduit (Figure 15-25). The foam was located on the flowing creek, stormwater ponds, and Lake Elmo. The foam was noted particularly after rain and wind events that occurred during the weeks of surface water and sediment sampling.
Figure 15-25. Heat map of PFAS-containing foam detections throughout Project 1007 study area.
Source: Project 1007 Minnesota Pollution Control Agency (MPCA 2023)..
The foam has been collected throughout the feasibility study from surface water across the Project 1007 corridor in accordance with the Michigan PFAS Action Response Team (MPART) protocols (MI EGLE 2019). Following collection, the foam is allowed to condense in the PFAS-free baggie before being sent to AXYS SGS laboratory in Canada for analysis of up to 40 PFAS compounds. The foam samples are screened for potential high concentrations prior to analysis by AXYS SGS method MLA 110, which aids the laboratory in understanding the potential variation in foam concentrations prior to analysis.
15.5.1.3 PFAS-Containing Foam Varied Textures or Type
PFAS-containing foam can have several different appearances across the Project 1007 region. Specific types of foam were not tied to an exact location, precipitation events, or seasons apart from frozen foam. Examples of different foam types are shown in Figure 15-26.
At three locations in Project 1007 (RC5, RC7, and RC12) in 2020, foam was collected and analyzed for PFAS twice to assess potential variation in PFAS concentrations depending on foam type. At each location, a “fluffy” foam sample was collected for comparison against a “thin” foam. PFOS concentrations from the larger and fluffier piles of foam were between two and three orders of magnitude greater than their thinner counterparts. The corresponding surface water samples had negligible variation in PFOS, suggesting that the PFAS enrichment in foam can be highly variable due to the environmental conditions.
Figure 15-26. Examples of various PFAS-containing foam observations and characteristics.
Source: Project 1007 Six-Month Investigation Progress Report, Minnesota Pollution Control Agency, October 13, 2020 (MPCA 2020).
15.5.1.4 Formation and Accumulation
The requirements for PFAS-containing foam to form and accumulate are typically:
- Turbulence—Air must be mixed into the water column for foam to form. This can be caused by water flowing over rocks, trees, or other debris in the stream. The water level greatly affects the locations of turbulence.
- Solid substrate—After formation, the foam bubbles must have a solid substrate in relatively calmer water to accumulate along or against. Without accumulation, the foam bubbles will collapse back into the stream water column. Foam can be found to accumulate along the stream banks, debris, blocks of ice, and vegetation growing in the stream channel.
- PFAS concentrations in surface water—Foam may naturally form regardless of the presence of PFAS. It is also not well understood how much PFAS will preferentially separate (enrich) into the foam relative to the PFAS in the corresponding surface water.
These and other factors affect the ability to predict occurrence and remediation of PFAS-containing foam. PFAS-containing foam has been encountered in surface water at the same order of magnitude (approximately 20 ppm) at a source area (Oakdale Disposal Site) and approximately 8 miles downgradient in the connected drainage system. Large masses of PFAS-containing foam have been visually noted to dissociate small portions of bubbles off from the larger mass, travelling downstream and potentially providing an additional PFAS source to the water bodies and/or sediments downstream. PFAS-containing foam has been observed to be intermittently present, as it may form and then dissolve back into the water column in a matter of minutes. This may impede response actions to removing the foam; reports of foam in known PFAS-impacted waters may not be present by the time a response action is attempted or it may form elsewhere in the surface water system.
15.5.1.5 PFAS-Containing Foam Enrichment Factors and Carbon Chain Length
An enrichment factor is the ratio of the PFAS concentration in the foam to that in the water (usually the top 6 inches of the water column). As shown in Figure 15-27, the enrichment factors for PFOS in the Project 1007 region varied by over an order of magnitude, supporting the environmental factors previously described as important to PFAS enrichment in foam in addition to PFOS concentrations in the corresponding surface water. The relative importance of environmental conditions that may influence PFAS enrichment are not well understood at this time.
Foam samples overwhelmingly consisted of long-chain PFSAs and PFCAs constituting up to 97% of the PFAS compounds in some samples (Figure 15-28). Longer chain PFAS like PFOA, PFOSA, PFOS, and N-EtFOSA tend to enrich or preferentially separate into the foam to a greater degree than shorter chain compounds like PFBA and PFBS because they are more hydrophobic.
Figure 15-27. Foam enrichment factors for paired surface water and foam samples, showing PFOS and PFOA concentrations.
Source: Project 1007 Minnesota Pollution Control Agency (MPCA 2023).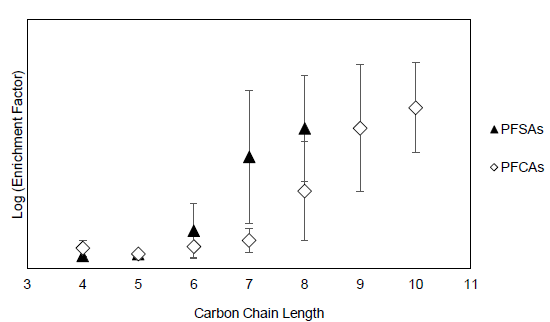
Figure 15-28. PFAS-containing foam enrichment factors and carbon chain length versus enrichment factors.
Source: Six-Month Investigation Progress Report (November 11, 2019—May 15, 2020) Project 1007 Minnesota Pollution Control Agency (MPCA 2020).
15.5.1.6 Risk Assessment
Risk assessments for PFAS are limited by lack of sufficient toxicological and exposure data for all but a few chemicals such as PFOS and PFOA. Therefore, to ensure protection to people and their pets who contact surface waters with PFAS-containing foams, the public needs to be broadly informed to avoid contact with any foam. Naturally occurring foams can also harbor bacteria and viruses. In areas with known PFAS contamination, targeted risk messages and outreach have also occurred.
According to the State of Michigan (MI DHHS 2019), incidental ingestion and extended, recurring, whole-body contact with PFAS-containing foam can result in a public health hazard for children and adults. Where PFAS-containing foam exists, the Michigan Department of Health and Human Services (MDHHS) recommends a health advisory to avoid the incidental ingestion of and whole-body contact with the foam as a precaution.
According to the Minnesota Department of Health (MDH), “PFAS-containing foam on surface water does not pose a risk to human health if skin contact with foam is minor and infrequent” MPCA 2020. MDH recommends informing people of observable foams in the PFAS-contaminated areas where concentrated PFAS could be encountered. Additionally, “MDH recommends:
- People and pets should avoid contact with foam on surface waters in this area.
- Wash skin that has come into contact with PFAS-containing foam with soap and water” MPCA 2020.
Other states, such as Wisconsin, provide a reporting system for suspected PFAS-containing foam across the state, and provide health advice to avoid the foam (WI DNR 2022).
More research is needed to determine how to estimate exposure to people, especially children; pets; aquatic organisms; water birds; and wildlife.
There are limitations on how to account for exposure estimates from foam concentrations, as well as the best way to sample for foam. Because the PFAS-containing foams form at the air-water interface, there are risks for higher exposure to swimmers, dabbling ducks, aquatic insects, etc., that are not accounted for with only collecting water column samples. Broad outreach to avoid any surface water foam is still not occurring.
In addition to outreach and messaging, using authorities from remediation or Clean Water Act regulations is critical for making progress on reducing the risks of PFAS to people and ecological species. Most states and tribes have narrative standards in their water quality standards that prohibit nuisance conditions on surface waters. These could be applied to restrict sources causing PFAS-containing foams.
15.5.1.7 Take-Aways for PFAS-Containing Foam
Based on this case study, the following takeaways with respect to PFAS-containing foam are:
- Foam occurs on surface water bodies naturally but may contain PFAS compounds when located near a source of PFAS releases. The PFAS-containing foam may look like naturally occurring foam.
- The foam occurs more frequently during precipitation and wind events. The foam appears to be a concentrated form of PFAS compounds, at higher levels than PFAS occurring in the surface water below the foam.
- Based on data collected to date, the predominant forms of PFAS in the foam are the longer chain compounds such as PFOS, PFOA, PFOSA, and N-EtFOSA rather than the shorter chain compounds such as PFBA and PFBS.
- PFAS-containing foam has been found in multiple waters in the Twin Cities East Metro, including waters that border parks and residential areas such as Raleigh Creek and stormwater ponds in Oakdale (including Tablyn Park) and the city of Lake Elmo. PFAS-containing foam has also been found on Battle Creek in Battle Creek Regional Park in St. Paul. This has resulted in the need for institutional controls for new developments and specific outreach by letter to residents.
- The best risk assessment advice is to avoid any surface water foam, because even naturally occurring foam can carry microbial risk to people or pets contacting it.
What PFAS-Containing Foam Is Not
- Not all foam on surface water bodies contains PFAS.
- Where PFAS-impacted surface water exists, PFAS-containing foam may not always be present, as it occurs more frequently with precipitation and wind events.
- PFAS-containing foam may not be removable in all circumstances and may re-occur in locations where it has been previously removed.
More information on Project 1007 is located on the MPCA website (MPCA 2023).
15.5.2 Surface Water/Groundwater Interaction Case Study (2023)
As mentioned in Sections 16.4.5, 5.3.4, and 10.3.1.2, surface water/groundwater interaction may play a role in a conceptual site model and locating places to sample. This case study provides three examples where this interaction can impact surface water quality.
15.5.2.1 North Carolina Example
The first example is found in the dialogue box in Section 16.6.4.1 and looks at PFAS in groundwater impacting surface water. A surface water body in North Carolina was found to have unacceptable concentrations of PFAS. An adjacent industrial facility had caused the groundwater to be contaminated with the same PFAS. An investigation of the groundwater showed that it is discharging to the surface water and contributing approximately 60% of the PFAS load to the surface water. A portion of the remedy for the site included groundwater extraction, treatment, and discharge to reduce the mass flux of PFAS in groundwater to the receiving surface water (NC DWR 2022).
15.5.2.2 Minnesota Examples
The second example is from Minnesota and provides a case study of PFAS-contaminated groundwater impacting surface water and PFAS-contaminated surface water impacting groundwater. These processes have significantly contributed to a 150-square-mile PFAS plume in groundwater that has impacted eight municipal water systems and 2,700 individual private water supply wells in Washington County, east of St. Paul. Wastes containing high PFAS concentrations originating at a manufacturing facility were disposed in two off-site landfills and several burial pits at the industrial facility. PFAS contamination in groundwater was found downgradient from the two landfills. Additional locations of groundwater containing PFAS were found in areas that were not expected based on groundwater flow directions (westerly and southwesterly) at the landfills.
As it turns out, surface water emanating from wetlands around one landfill carried PFAS to the east where it infiltrated to groundwater 1 mile downstream. This groundwater resurfaced as surface water and flowed to the east in a system of creeks, ditches, and pipelines that entered several lakes and ponds. Stormwater runoff was conveyed by the same conveyance system providing additional transport of PFAS to the east. The surface water transport and the exfiltration from the conveyance features and lakes/ponds resulted in PFAS in groundwater along the surface water path and downgradient from the lakes. The PFAS contamination along this route was enhanced by the discharge of extracted groundwater containing PFAS and other pollutants adjacent the second landfill to the same stormwater conveyance system discussed above over a period of 7 years. This conveyance system terminates at the St. Croix River 6 miles downstream from the first landfill. Thus, at this site there is PFAS in groundwater, daylighting as a surface water and then re-entering groundwater as the water is transported downstream and temporarily resides in various lakes and pond. This results in exposure through use of the groundwater for municipal purposes and use of the surface waters for municipal purposes, fishing, recreation, and wildlife habitat. (Regenesis 2019).
The third example is from Minnesota and is a subset of the second example. In one location overlying the 150-square-mile groundwater PFAS plume is a site where several different mixtures of AFFF were used to put out a fire at a plastics manufacturer. The runoff from the fire suppression went down a ditch to a small surface water body. Migration of surface water to groundwater at that location resulted in contamination of groundwater by PFAS impacting several private water supply wells that were completed on the order of 250 feet in depth. Sampling showed that the less mobile, longer chained PFAS PFOS and PFHxS had the highest concentrations in the sediments along the ditch. The sediments at the surface water body still contained those two PFAS, but not at as high of a proportion relative to the more mobile, shorter chained PFAS PFOA and PFBA as found along the ditch. The water in the surface impoundment had substantially more PFOA and PFBA than PFOS and PFHxS. This shows not only the transport of PFAS in surface water to groundwater, but the changing composition of PFAS in the surface water due to varying portioning properties of PFAS.
15.5.2.3 Summary
These three examples demonstrate the need to assess the potential surface water/groundwater interactions when looking for sources of contamination, routes of exposure, and establishing a CSM. These examples show the potential for adverse impact, but do not provide an assessment of the potential change in PFAS constituents and concentrations that may occur during the movement of water from surface water to groundwater or groundwater to surface water. Those potential changes are associated with biotransformation that may occur due to water chemistry changes in the vicinity of the groundwater-surface water interface. A discussion of this issue is found in Section 5.3.4.2). An additional example of PFAS impacts from a groundwater/surface water interaction can be found in Section 5.3.4.
–
Updated January 2026.

