6 Media-Specific Occurrence
The long period of time during which PFAS have been produced and the many sources of PFAS release to the environment have resulted in low-level contamination of most environmental media worldwide. The concentrations of these human-caused ambient or “anthropogenic background” concentrations may vary widely, based on proximity to industrial areas, patterns of air and water dispersion, and many other factors. As a result, any claims regarding “universal” values for anthropogenic background levels of PFAS should be viewed skeptically.
This section provides a relative understanding of PFAS concentrations in various environmental media but does not represent an exhaustive literature review. These figures and summaries are intended to provide context to the reader and a starting point for further study. Media-specific occurrences of PFAS are constantly being added in the literature and on state, federal, and other countries’ PFAS websites. USEPA has developed an online database called the PFAS Analytic Tools that provides access to different sources of information about potential PFAS sources, drinking water sampling data, occurrence in environmental media, and other types of information (USEPA 2023).
| Section Number | Topic |
|---|---|
| 1.4.4 | Health Effects of Ultra-short-chain PFAS (2025) |
| 1.7 | Priority Topics for Biosolids Land Application (2025) |
| 6.1 | Air |
| 6.2 | Soil, Sediment, and Biosolids |
| 6.3 | Groundwater |
| 6.4 | Surface Water |
| 6.5 | Biota |
The following sections include figures summarizing the observed concentrations of PFAS that have been reported in the recent literature (approximately 2017–2022) and new information to date on the occurrence of PFAS in media that were not included in the previous version of this guidance document for outdoor air, indoor air, precipitation, dust, soil, sediment and biosolids. The figures for ground water and surface water were updated with the new format, but the data are from the previous summary. The previous version of this section (June 2022) is archived as a PDF under Archived External Tables and Sections on the home page of this site. Figure 6-5, Observed PFAS concentrations in fish, has not been updated.
Tables (linked as PDFs) that include important details concerning the studies used in developing the figures below and interactive versions of the figures (linked as a web page) are in Section 17.1. The figures were developed using R software and the static figures were developed using ggplot2 (Wickham 2016). Media-specific occurrence information that was included in the previous version of this guidance document (June 2022) is archived as a Section 17.1 PDF, found under Archived External Tables and Sections on the home page of this site.
As discussed in Section 2.6, the presence of some PFAS in environmental media and ecological receptors has been traced to the migration of PFAS in air emissions and through the direct discharges to soil, groundwater, and surface water. Sections on Phase Partitioning (Section 5.2) and Media-Specific Migration Processes (Section 5.3) illustrate that PFAS occurrence in the air, aqueous, and solid phases is highly interrelated. Sections on Human Health Effects (Section 7.1) and Ecological Toxicology (Section 7.2) suggest that PFAS risks to human health may result from exposure via drinking water, groundwater, soils, food, and other media types. Further, ecological impacts are widely observed. This suggests that a complete assessment of PFAS sources and exposure risks, including fate and transport processes that may drive future exposure concerns, requires understanding of PFAS occurrence across multiple phases. The processes that influence media-specific PFAS concentrations are illustrated in CSMs shown in Figure 2-20, Figure 2-21, and Figure 2-22. This section focuses on occurrence in air; soil, sediment, and biosolids; groundwater; surface water; and biota. Section 1.4.4 focuses on available information for health effects of ultra-short-chain (ultrashort) PFAS. Summaries of available environmental occurrence data for ultrashort PFAS are included with the health effects information, but the summaries are not intended to be comprehensive.
Environmental PFAS occurrence is an area of active research. As discussed in Section 11, sampling and analytical methods are still being optimized and standardized, and vary between studies. Data-reporting formats also vary, often including the observed minimum, maximum, or percentiles to represent the range, and arithmetic mean, geometric mean, or median values to represent central tendency. In some cases, only the average or maximum values are reported. Studies also vary in terms of research objectives and site characteristics, focusing on relatively pristine (for example, rural) or impacted (for example, industrial) sites. Some studies focus on certain PFAS, Finally, variable method detection limits between studies introduces the potential for non-detect data to impose artificial patterns. Due to these data limitations, the ranges and averages of detected PFAS concentrations presented in the following figures should be considered as a general frame of reference, rather than precise, dispositive thresholds.
6.1 Air
Certain PFAS are found in ambient air, with elevated concentrations observed or expected in urban areas nearest to major emission sources described in Section 2.6. These include industrial facilities that produce PFAS or use PFAS chemicals or products in manufacturing; areas where Class B firefighting foams containing fluorine are used or released; waste management facilities, including landfills and wastewater treatment plants; and areas of biosolids production and application (Borthakur et al. 2022; Barton et al. 2006; Ahrens et al. 2011; Liu et al. 2015).
As discussed in Section 5.3.2, short-range atmospheric transport and deposition may result in PFAS contamination in terrestrial and aquatic systems near points of significant emissions, contaminating soil, groundwater, and other media of concern (Davis et al. 2007), as well as several miles from industrial emission sources (Shin et al. 2011; Post, Cohn, and Cooper 2012) (NYS DOH 2016; NH DES 2017; VT DEC 2016). Releases of ionic PFAS from factories are likely tied to particulate matter (Barton et al. 2006[241]), which settle to the ground in dry weather and are also wet-scavenged by precipitation as discussed in Section 5.3.2. Models indicate that deposition depends on amount of PFAS emissions, local topography, particle size, weather patterns, and release characteristics such as smokestack height, effluent flow rate, and effluent temperature. In addition to short-range transport and deposition, long-range transport processes are responsible for a wide distribution of PFAS across the earth, as evidenced by their occurrence in biota and environmental media in remote regions as far as the Arctic and Antarctic. Long-range transport processes and effects are similar to atmospheric transport of other recalcitrant contaminants.
The PFAS and Vapor Intrusion Fact Sheet developed in 2025 includes information about PFAS in Soil Vapor, Indoor Air, and Outdoor Air. The Priority Topics for History, Use, and Naming Conventions include information about less-studied PFAS (see Section 1.1.3), including ultrashort PFAS, volatile PFAS, and fluorinated gases.
6.1.1 Outdoor Air
Concentrations of perfluoroalkyl acids such as PFOA and PFOS reported in outdoor air in the recent scientific literature (2017–2022) typically fall within a range of about 1–30 pg/m3 (picograms/cubic meter) (Figure 6-1A). However, near major industrial sources, including fluorochemical manufacturing complexes in China (Zhao et al. 2020) and South Korea (Lee et al. 2020; Lin et al. 2020; Seo et al. 2019), maximum PFOA concentrations in the range of about 50–200 pg/m3 have been reported. In the United States, concentrations of PFOA as high as 900,000 pg/m3 have been observed near a large manufacturing facility in Parkersburg, West Virginia (Barton et al. 2006). PFOS concentrations greater than 2,000 pg/m3 have also been observed in outdoor air near major fluorochemical manufacturing complexes in South Korea (Seo et al. 2019). Concentrations of PFBA have been observed in the hundreds of pg/m3 at a number of global monitoring sites and at concentrations greater than 1,000–2,000 pg/m3 at sites in Canada (Rauert et al. 2018).
The literature range of concentrations of volatile PFAS such as FTOHs is in the hundreds of pg/m3 in outdoor air (Figure 6-1A ). Atmospheric transport and deposition of PFAS occur on regional and global scales, suggesting that low-level concentrations detected in soil or other media are not necessarily indicative of a local source (Section 5.3.2). More information is included in Section 17-1, Media-Specific Occurrence Tables.
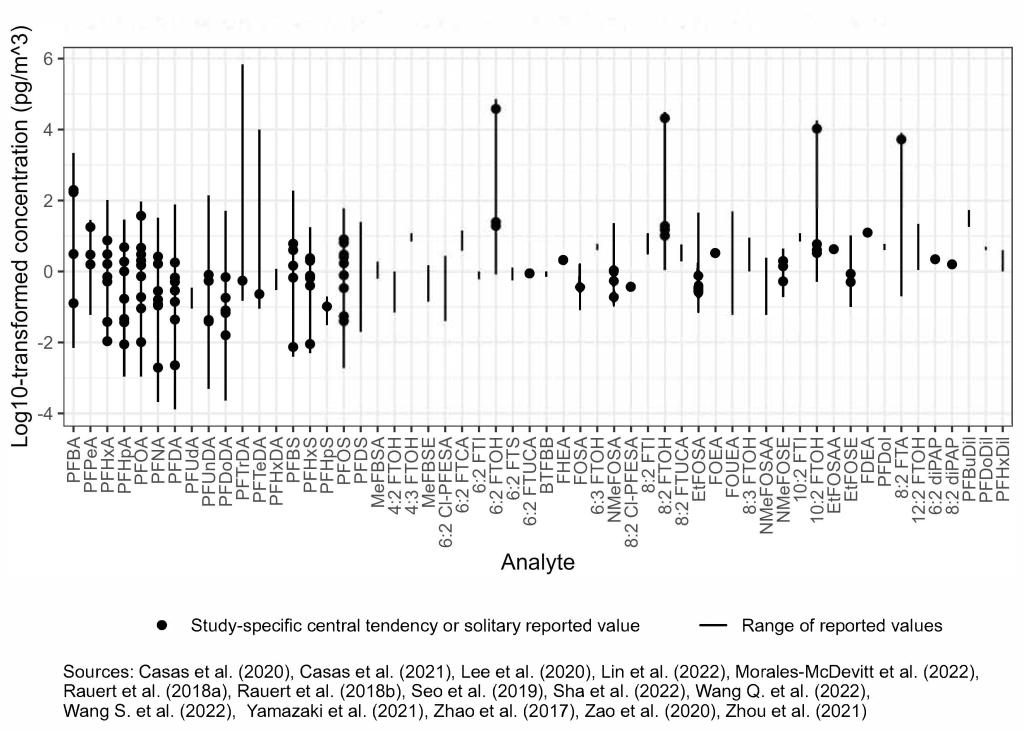
Figure 6-1A. Observed PFAS concentrations in outdoor air.
Source: Figure developed using ggplot2 (Wickham 2016)
6.1.2 Indoor Air
PFAS have also been observed in indoor air and dust in homes, offices, and other indoor environments (Figure 6-1B). Indoor air concentrations of certain PFAS can be higher than outdoor air concentrations due to the presence of indoor sources (Fromme et al. 2015; Fraser et al. 2012; Goosey and Harrad 2012; Shoeib et al. 2011; Kaiser et al. 2010; Langer, Dreyer, and Ebinghaus 2010; Strynar and Lindstrom 2008; Shoeib et al. 2004). Examples of indoor sources of potential PFAS exposure include stain- and water-resistant coatings used on a number of consumer products, such as carpets, upholstery, clothing, grease-resistant paper, food packaging, and nonstick cookware and ingredients in cleaning products, personal care products, cosmetics, paints, varnishes, and sealants (ATSDR 2019; Liu et al. 2015; Liu et al. 2014) (Gewurtz et al. 2009; Guo et al. 2009). In the recent literature (2017–2022), PFOA concentrations in PM2.5 collected from indoor air across 17 kindergartens in Hong Kong ranged from about 200–1,900 pg/m3 (Li et al. 2021). In a study of 57 households in eastern Finland, concentrations of PFOA and PFOS ranged from nondetect to about 100 pg/m3 and 7 pg/m3, respectively (Winkens et al. 2017).
Concentrations of volatile PFAS such as FTOHs have been reported on the order of 10,000–50,000 pg/m3 in schools, homes, and offices. Concentrations of FTOHs have been observed in excess of 300,000 pg/m3 inside commercial buildings (Fromme et al. 2010) and as high as 255,000 pg/m3 in residences in the area of Oslo, Norway (Padilla-Sanchez et al. 2017). More information is included in Section 17-1, Media-Specific Occurrence Tables.
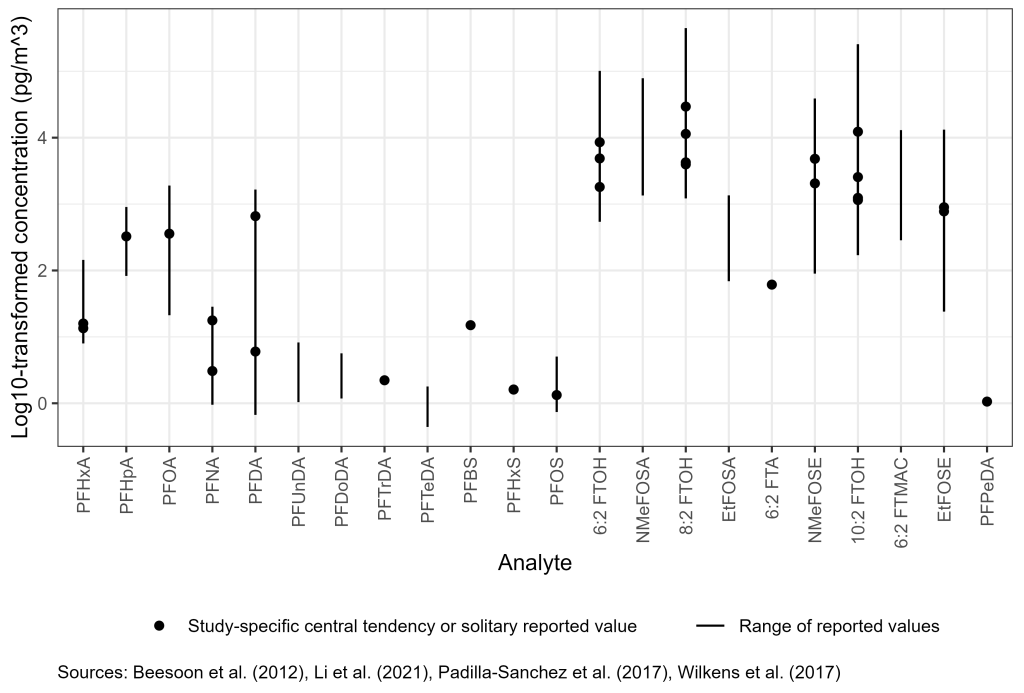
Figure 6-1B. Observed PFAS concentrations in indoor air.
Source: Figure developed using ggplot2 (Wickham 2016)
6.1.3 Settled Dust
PFAS have been measured in settled dust from floors and other surfaces and from samples collected from air conditioner filters, vacuum cleaner bags, and carpets from a variety of indoor environments, including schools and universities, preschools and childcare facilities, homes, and workplaces (Young et al. 2020; Zheng et al. 2019; Ao et al. 2019; Besis et al. 2019; de la Torre et al. 2019; Giovanoulis et al. 2019; Byrne et al. 2017; Beesoon et al. 2012). The literature range of concentrations of PFAS in dust in indoor environments vary over many orders of magnitude (Figure 6-1C). Concentrations of PFOA and PFOS range from nondetect to about 650 ng/g and 3,000 ng/g, respectively. Fluorotelomers have also been observed in indoor dust, ranging from nondetect to about 2,500 ng/g for FTOHs. Fluorotelomer phosphate diesters (diPAPs) were reported in a study of preschools in the area of Stockholm, Sweden, and ranged from nondetect to greater than 42,000 ng/g (Giovanoulis et al. 2019). More information is included in Section 17-1, Media-Specific Occurrence Tables.
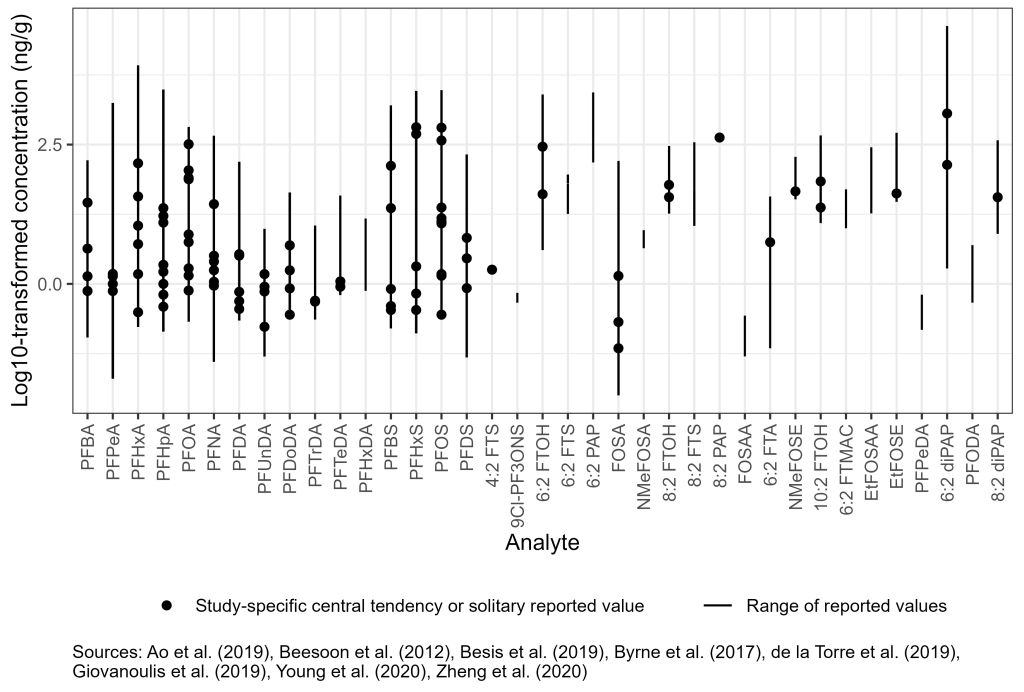
Figure 6-1C. Observed PFAS concentrations in settled dust.
Source: Figure developed using ggplot2 (Wickham 2016)
6.1.4 Precipitation
PFAS have also been observed in precipitation and other samples impacted by precipitation, including rainwater, surface and subsurface snow, sea ice, and meltwater. The literature range of concentrations of PFAS in precipitation vary over many orders of magnitude (Figure 6-1D) (Casas et al. 2021; Pike et al. 2020; Xie et al. 2020; Chen et al. 2019; MacInnis et al. 2019; Wang et al. 2019; Lu et al. 2018; Casal et al. 2017; Yeung et al. 2017; Zhen et al. 2015; Taniyasu et al. 2008; Barton, Kaiser, and Russell 2007; Kim and Kannan 2007). Lower levels of PFAS have been observed in precipitation from remote locations such as the Arctic and Antarctic as compared to more populated and urbanized, continental regions. Concentrations of perfluoroalkyl acids in precipitation, such as PFOA and PFOS, were typically <1 ng/L in remote regions, while concentrations greater than 1,600 ng/L and 50 ng/L were observed, respectively, in continental regions. Fluorotelomers, including FTOHs, fluorotelomer sulfonic acid (FTSA), and fluorotelomer unsaturated carboxylic acids (FTUCAs), have been observed in precipitation with concentrations of FTOHs and FTSA exceeding 100 ng/L (Chen et al. 2019; Zhen et al. 2015) and FTUCAs ranging from nondetect to about 2 ng/L (Chen et al. 2019; Taniyasu et al. 2008). Heptafluoropropoxy propanoic acid (HFPO-DA), or GenX, has also been found in precipitation as high as 5 ng/L (Pike et al. 2020). More information is included in Section 17-1, Media-Specific Occurrence Tables.
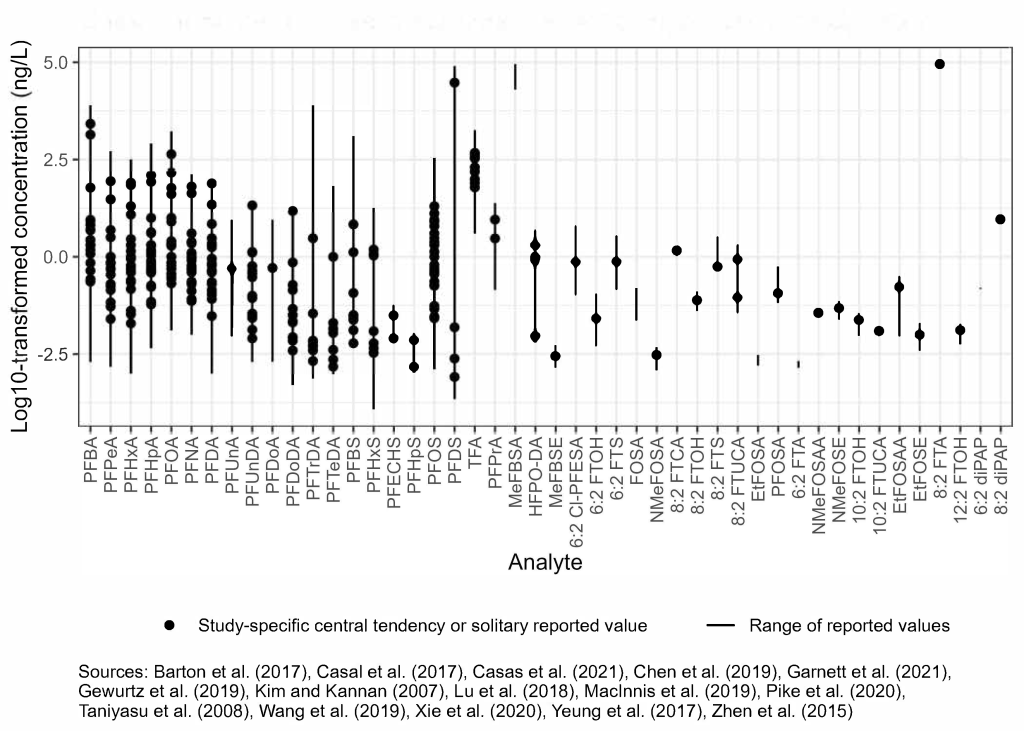
Figure 6-1D. Observed PFAS concentrations in precipitation.
Source: Figure developed using ggplot2 (Wickham 2016)
6.2 Soil, Sediment, and Biosolids
PFAS occurrence in soil and sediment can result from direct inputs (for example, AFFF releases or industrial discharge) or indirectly through exposure to impacted media (for example, atmospheric deposition, landfill leachate, or wastewater effluent). Another focus of current research is agricultural application of biosolids, compost, or pesticides, all of which are potential PFAS sources (Table 2-6). As a result of these inputs, soil and sediment may act as secondary sources of PFAS via leaching to groundwater and runoff to surface water through leaching and percolation processes, respectively. The concentration and distribution of PFAS observed in soils, sediments, and biosolids is complex and can be a function of source (direct versus indirect), site-specific considerations (for example, TOC, particle surface charges, and phase interfaces, see Section 5.2.3) and PFAS-specific chemistry (for example, alkyl chain length and ionic functional group). PFOS, PFOA, and other long-chain PFAAs are typically the predominant PFAS reported in surface soils and sediments (Cai et al. 2022; Rankin et al. 2016; Strynar et al. 2012; Zhu et al. 2019). Based on the increasing interest in biosolids, data related to that topic have been compiled separately from other sources.
6.2.1 Soil
Surface and subsurface soil are a significant reservoir for PFAS released to the environment. Numerous studies show individual PFAS concentrations in soil vary across multiple orders of magnitude, found at low concentrations (<1 ug/kg) globally even in remote areas, and at concentrations exceeding 1,000 μg/kg at industrial and AFFF release sites (Rankin et al. 2016; Brusseau et al. 2020) (Figure 6-2A).
Improving the understanding of anthropogenic background PFAS concentrations for comparison to site data has been a focus of recent work. A survey of anthropogenic background concentrations of PFAS in soil found PFOS ranging from 0.003 to 162 ug/kg and PFOA from 0.01 to 124 ug/kg (Brusseau et al. 2020). Although not focused on contaminated sites, many of the surveys were in or near populated regions and included agricultural fields. Recent studies in Maine and New Hampshire also focused on anthropogenic background soil levels without identified sources and in those studies PFOS ranged from nondetect to 5.4 and PFOA from nondetect to 5.3 ug/kg for the combined data. Median data for detected PFOS were 0.37 and 0.94 ug/kg, and for PFOA, 0.17 and 0.76 ug/kg for Maine and New Hampshire, respectively (MEDEP 2022; Santangelo et al. 2022). In contrast, data at known PFAS release sites such as fire training areas and biosolids application sites showed maximum concentrations of PFAS that may exceed anthropogenic background by several order of magnitude. PFOS and PFOA in fire training areas and other source zones may be as high as 373,000 and 50,000 ug/kg respectively, though the median values for AFFF source zones were much lower—18 and 1.4 ug/kg for PFOS and PFOA (Brusseau et al. 2020).
Published data on soil PFAS concentrations in industrial settings are limited, and can be highly variable, depending on the nature of PFAS release and proximity to the source. More information is included in Section 17-1, Media-Specific Occurrence Tables. Additional detail on AFFF is found in Section 3.
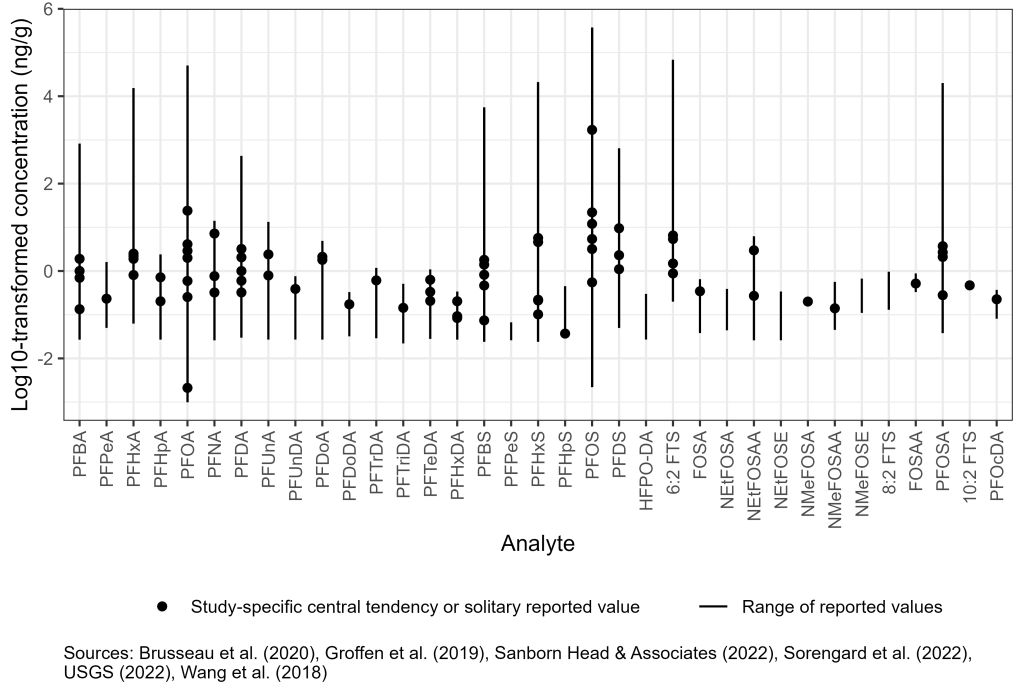
Figure 6-2A. Observed PFAS concentrations in site and anthropogenic background soil.
Source: Figure developed using ggplot2 (Wickham 2016)
6.2.2 Sediment
Direct discharge of AFFF, leachate, wastewater effluent, and runoff to surface waters and subsurface discharge of contaminated groundwater to surface water has resulted in PFAS impacts to freshwater and marine sediments. Detected concentrations for surface sediments in lakes and rivers reported in the literature generally range from below detection limit to approximately 100 μg/kg, and concentrations and relative distributions of PFAS are variable depending upon types of sources and distance from point sources (Figure 6-2B).
A study of 48 lakes and two reservoirs with different limnological and geographic settings across China found surface sediment concentrations for a sum of detected PFCAs + PFOS ranged from 0.086 to 5.79 ng/g with a detection frequency of 100%. These samples collected in 2010–2013 showed that PFAS concentrations correlate to parameters such as TOC, nitrogen, and phosphorus in sediment (Qi et al. 2016).
A study from the Great Lakes (Codling et al. 2018) evaluated the use of dated sediment cores to assess PFAS deposition trends and analyzed for 22 PFAS. Reported values for the sum of PFAS in cores ranged from nondetect to 68.3 ug/kg dry weight, with the max value attributed to a detection of PFHpA of 46.6 μg/kg at that location. Concentrations typically increased with time in the cores. Grab samples were also collected, and PFOS ranged from 0.1 to 2.5 ug/kg, PFOA from nondetect to 3.0 ug/kg, and PFHpA from nondetect to 8.5 ug/kg. Concentrations in grab samples for the sum of PFAS ranged from nondetect to 26.0 ug/kg. Sediment core analysis may be effective for estimating deposition rates and fluxes for a subset of PFAS that exhibit strong sorption to sediment, with concentration at a given depth interval representing deposition during that time period (Codling et al. 2018).
A Swedish study of sediment cores in a lake and pond impacted by AFFF showed that PFOS and PFHxS were the dominant PFAS in sediment. Concentrations of PFOS and PFHxS ranged as high as 64 and 13 ng/g, respectively, and the study identified peak deposition rates occurring between 2003 and 2009, which correlated with reported activity near the water bodies (Mussabek et al. 2019).
Large precipitation or storm events can also contribute to episodic or enhanced transport of sediment and resuspension or redistribution of contamination in some environmental settings. Resampling of marine sediment locations in Florida following the passage of a hurricane found sediment concentrations of total PFAS decreased 47% averaged across nine sites. Highest concentrations of PFAS were spatially correlated to potential sources such as military installations and manufacturing facilities, and across all locations short-chain PFCAs dominated the total PFAS at 68% of locations, while long-chain PFAAs dominated the other 32% of sites (Ahmadireskety et al. 2021). Sediment in two urban watersheds showed concentrations of individual PFSAs as high as 88 ng/g, and found seasonal variability in sediment concentrations, potentially related to higher/lower water flows, or variation in organic matter and uptake during algal blooms (Bai and Son 2021). Once deposited, sediments can directly impact biota and can influence surface water concentrations. Tributary sediments with a mix of potential sources were shown to be potential secondary sources of PFAAs once those sediments were transported to a receiving water body (Balgooyen and Remucal 2022). Figure 6-2B illustrates the concentration distribution in sediment across multiple environmental settings from these recent studies. More information is included in Section 17-1, Media-Specific Occurrence Tables.
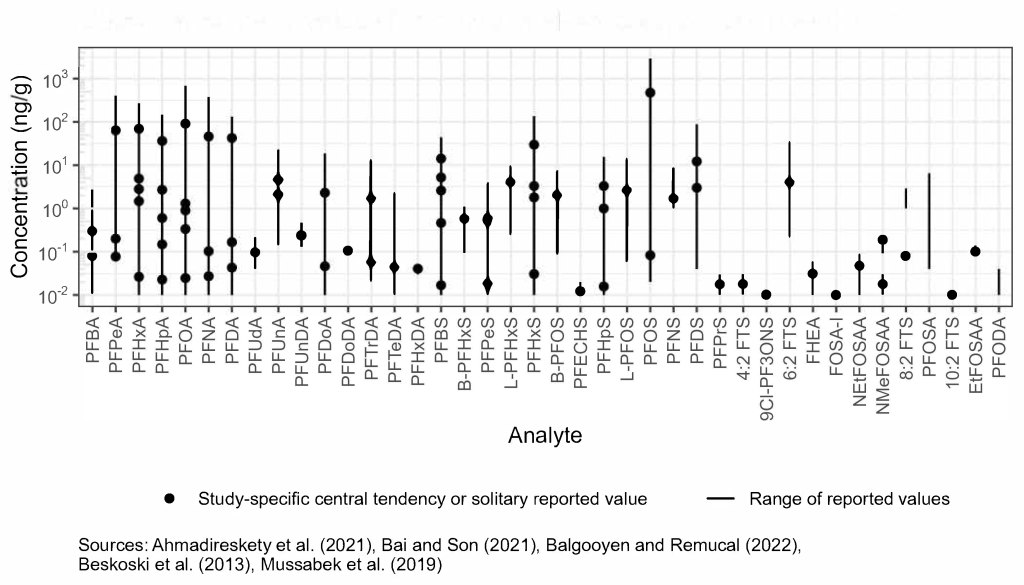
Figure 6-2B. Observed PFAS concentrations in sediment.
Source: Figure developed using ggplot2 (Wickham 2016)
6.2.3 Biosolids
PFAS occurrence in biosolids is reported to be prevalent across the United States at a wide range of concentrations, and may be from municipal, residential, or industrial sources, or a combination of any of those sources. Biosolid designations may include “land applied,” Class A, Class B, Class C, unclassified, and mixed land-applied organic waste products. New information about PFAS occurrence at land application sites has been compiled in the Priority Topics for Biosolids Land Application, see Section 1.7.2.2 and Section 1.7.2.3.
A 2013 study of archived samples of biosolids from 2001 in the United States, which targeted 12 PFAAs and PFOSA, reported mean concentrations of PFOS (403 ng/g) and PFOA (34 ng/g) with the mean values of other PFAAs ranging from 2 to 21 ng/g. With the exception of PFBA, PFBS, and PFHpA, the target PFAAs and PFOSA were detected in all samples (Venkatesan and Halden 2013). A 2021 review of reported values for biosolids, compost, and related biowastes highlighted the wide concentration range of reported PFAS (primarily PFAAs) and the relationship of biowaste source to resulting concentrations (Bolan et al. 2021). Figure 6-2C illustrates concentration ranges in biosolids for a selection of PFAS from a subset of recent data. Early studies reported that the most abundant PFAAs (see Section 2.2.3.1) found in biosolids (PFOS and PFOA) are similar to those found in wastewater effluent, although biosolids may also contain other PFAS, including long-chain PFAS (Hamid and Li 2016; Washington et al. 2010). Although multiple studies have reported data showing transformation of polyfluorinated substances to PFAAs in land-applied biosolids (Yoo et al. 2010; Sepulvado et al. 2011; Washington et al. 2010), other evidence indicates that some polyfluorinated substances remain in biosolids-amended soils for many years to decades (Yoo et al. 2010; Rich et al. 2015; Washington et al. 2018).
PFOS is the most frequently reported PFAS and typically at the highest concentration of the PFAAs most frequently reported (Clarke and Smith 2011; Gallen et al. 2018; Moodie et al. 2021; Munoz et al. 2021; Pepper et al. 2021). Target and nontarget precursor compounds are also commonly detected in biosolids, including 6:2 diPAP and 6:2 FTS (Kim Lazcano et al. 2020; Schaefer et al. 2022; Moodie et al. 2021), EtFOSAA, and cationic and zwitterionic electrochemical fluorination precursors to PFOS (Munoz et al. 2021). Biosolids tend to be enriched in long-chain PFAAs containing more than six carbon atoms (Kim Lazcano et al. 2019).
Repeated application of biosolids to agricultural soil can result in PFAS accumulation in shallow soil depths, and eventual leaching to groundwater, as well as uptake by agriculturally sourced products (Ghisi et al. 2019). “Shallow soil” in this context will be variable depending on the crop or farm practices. For example, Maine considers 0–2 feet to be the “plow layer” (ME DEP 2023), whereas USEPA refers to shallow soil “extending to site-specific depths that can be sampled easily by manual methods,” generally 0–12 inches (USEPA 2023). Based on the biosolid application rates in the United States and the mean total PFAS concentrations observed for archived biosolids from 2001, it is estimated that 1,375–2,070 kg of PFAS may have been added to agricultural land annually across the United States during that time (Venkatesan and Halden 2013). Data for more recent testing of biosolids and compost typically show lower concentrations of PFAAs and lower annual application rates (Bolan et al. 2021).
PFAS concentrations in soils at sites with applied biosolids or sludge will vary depending upon application rates, frequency, duration, geochemical and hydrogeologic factors, and concentration of PFAS in the applied material. Perfluorocarboxylic acids (PFCAs) and perfluoroalkylsulfonic acids (PFSAs) have been observed in surface soils treated with biosolids at 1 and 2 orders of magnitude higher than global anthropogenic background soils, respectively (Johnson 2022). In contrast, another study observed that even after decades of land application, the concentration and accumulation of PFAS in soils where biosolids were applied was comparatively low. In addition, the study observed that there was ~73% attenuation of measured PFAS from the shallow soil sample at 30.5 cm to the deepest interval of 183 cm (Pepper et al. 2021). This variability of reported data illustrates the importance of site-specific history and conditions to resulting concentrations in soil at land application sites.
Ultra-short-chain PFAS, certain precursors to PFAS, and new generation PFAS potentially account for a significant fraction of the total fluorine present in biosolids, but are largely unquantifiable by current standard methods (Kim Lazcano et al. 2020; Munoz et al. 2021; Schaefer et al. 2022). The highest average minimum and maximum concentrations observed in recent publications were n:2 polyfluoroalkyl phosphoric acid esters, polyfluoroalkyl phosphates, and fluorotelomer phosphates (diPAPs). In addition to diPAPs, perfluoroalkane sulfonamido acetic acids (FASAAs), perfluorooctane sulfonamides, and fluorotelomer sulfonic acids (FTS) were abundant (Munoz et al. 2021; Schaefer et al. 2022). This suggests that limiting PFAS analysis of biosolids to the standard suite of analytes may not account for a substantial fraction of the overall fluorine mass (Schaefer et al. 2023; Thompson et al. 2023). Of the perfluoroalkyl acids (PFAAs), long-chain perfluoroalkyl sulfonic acids (PFSAs) were present at the highest concentrations, likely due to their hydrophobicity and greater tendency to remain sorbed to soils within the vadose zone (Figure 6-2C). More information is included in Section 17-1, Media-Specific Occurrence Tables.
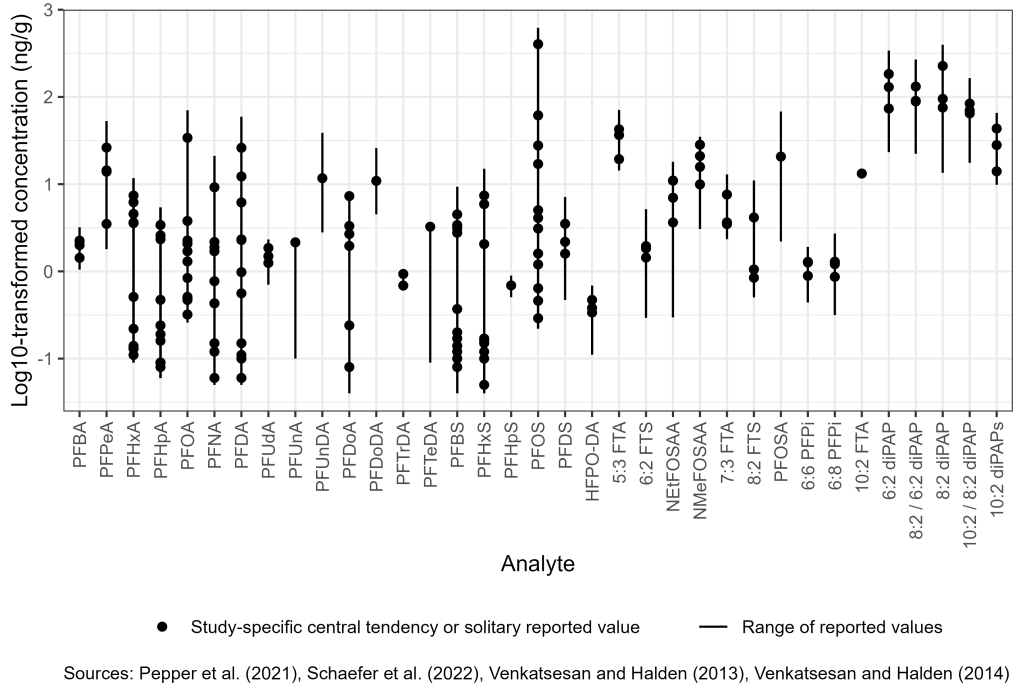
Figure 6-2C. Observed PFAS concentrations in biosolids and land-applied soil.
Source: Figure developed using ggplot2 (Wickham 2016)
6.3 Groundwater
USEPA has assembled an extensive data set of the occurrence of six PFAAs in public drinking water. This data set is the result of required monitoring of approximately 4,900 public water systems (all large systems serving more than 10,000 people, plus a subset of smaller systems) for six PFAAs in finished drinking water at points of entry to the drinking water distribution system. The study was conducted between 2013 and 2015 under the third Unregulated Contaminant Monitoring Rule (UCMR3) and included the results from treated water that originated from groundwater wells (n = 22,494), groundwater under the direct influence of surface water (n = 436), surface water sources (n = 13,228), and mixed sources (n = 814) (USEPA 2017). A summary of the UCMR3 occurrence data, including analytical reports, is included in Section 8.2.2.4. An analysis conducted on the nonfinalized UCMR3 data set found that one or more PFAAs were detected in 4% of the reporting public water systems (USEPA 2017); however, groundwater sources had approximately double the detection rate of surface water sources (Hu et al. 2016).
As of June 2022, USEPA issued interim health advisories for PFOA and PFOS in drinking water (USEPA 2022). These replace the former values USEPA issued in 2016 of 70 ng/L (USEPA 2016, 2016). The interim values of 0.004 ng/L for PFOA and 0.02 ng/L for PFOS are lower than the minimum detection limit of 0.52 ng/L for drinking water methods (ITRC Table 11-3, PFAS Analytical Methods Excel file). Therefore, all detected concentrations would be above the interim health advisories. Detections were geographically widespread but showed quantifiable associations with suspected sources, including industrial sites, military fire training areas, AFFF-certified airports, and wastewater treatment facilities (Hu et al. 2016). Individual states are collecting information on PFAS occurrence in smaller public water supplies such as schools and mobile home parks that do not meet the threshold to comply with the Unregulated Contaminant Monitoring Rule, so were not sampled during UCMR3, and for which data are often publicly available, for example, in New Hampshire at NH DES (2020). UCMR5 will include a larger list of PFAS analytes, public water systems (PWSs) serving 3,300 or more persons, and up to 800 smaller PWSs (USEPA 2021).
Groundwater occurrence data collected as part of domestic and international studies have also characterized the range of PFAS concentrations associated with AFFF release sites, industrial facilities, and landfills; examples of these study results are provided in Figure 6-3. More information is archived as a Section 17.1 PDF, found under Archived External Tables and Sections on the home page of this site.
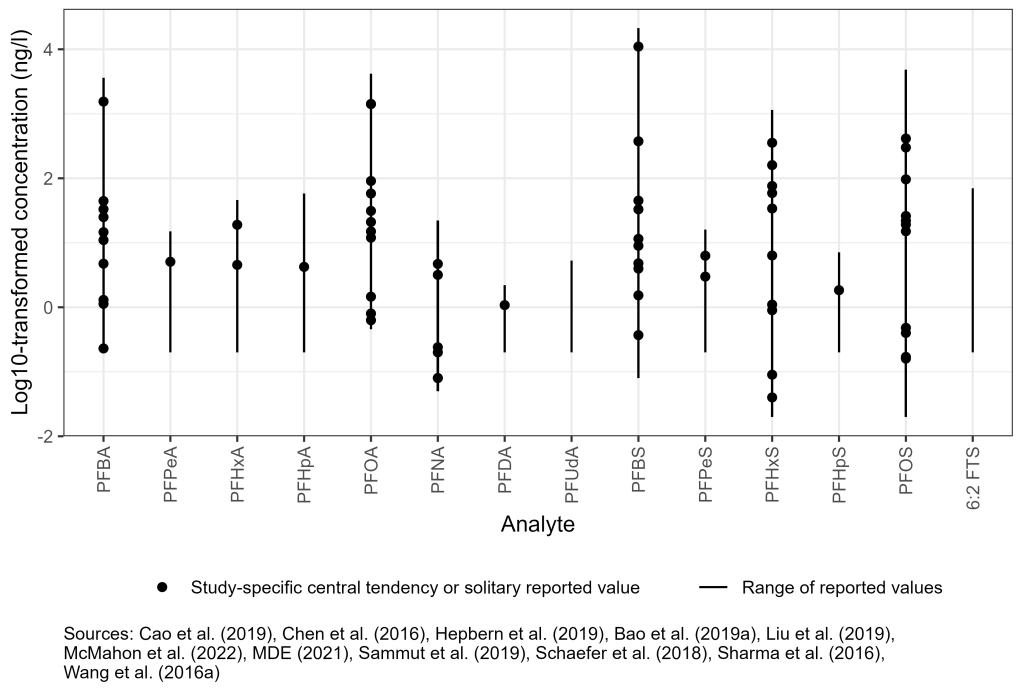
Figure 6-3. Observed PFAS concentrations in groundwater.
Source: Figure developed using ggplot2 (Wickham 2016)
6.4 Surface Water
Freshwater, marine water, and stormwater PFAS concentrations usually depend on proximity to the point of release and source concentrations. In addition to releases associated with identified sources, stormwater runoff from nonpoint sources may contribute significant loads of PFAS to surface water (Wilkinson et al. 2017; Zushi and Masunaga 2009). The sorption of PFAS to suspended solids may affect surface water PFAS concentrations. Suspended microplastics may also influence PFAS in surface water (Llorca et al. 2018). Figure 6-4 presents examples of observed PFOS and PFOA surface water concentrations, organized by source type. In addition to PFOS and PFOA, many other PFAS have been observed in surface waters, including compounds other than PFAAs. For example, a recent study found perfluoro-2-propoxypropanoic acid (PFPrOPrA also known as the GenX chemical HFPO-DA) in untreated water drawn from the Cape Fear River in North Carolina at concentrations up to 560 ng/L, and GenX was just one of many non-alkyl acid PFAS identified (Sun et al. 2016). Surface water occurrence is also an important source of drinking water supply impacts (USEPA 2018; Post et al. 2013). More information is archived as a Section 17.1 PDF, found under Archived External Tables and Sections on the home page of this site.
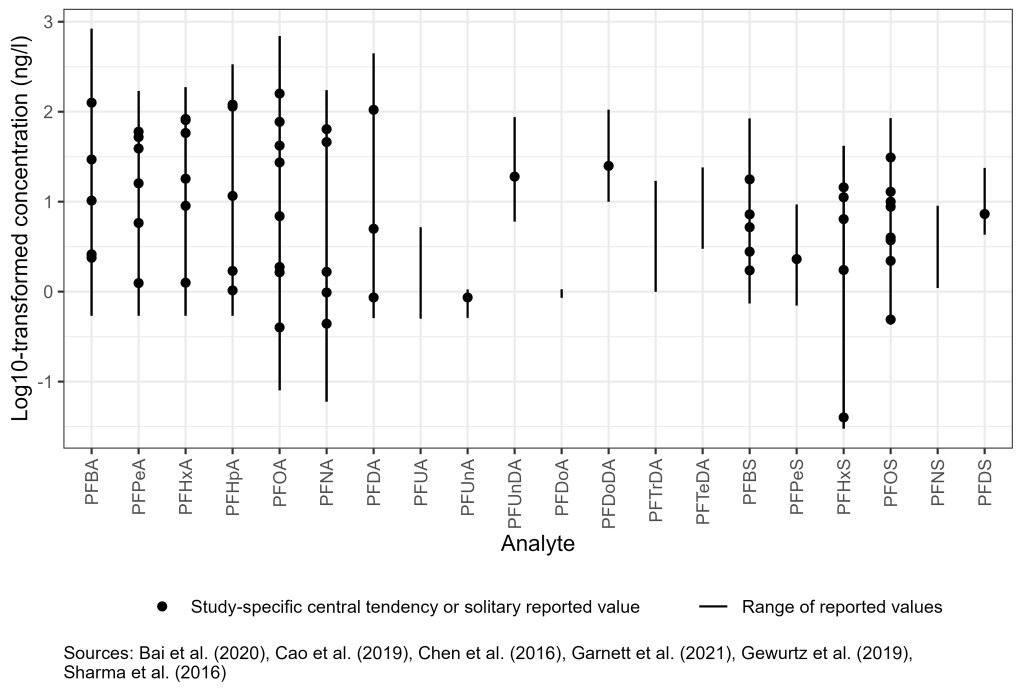
Figure 6-4. Observed PFAS concentrations in surface water.
Source: Figure developed using ggplot2 (Wickham 2016)
6.5 Biota
Because PFAS are distributed globally and have a propensity to bioconcentrate, they have been found in fish, wildlife, and humans. PFAAs, particularly PFOS, are typically the dominant PFAS detected in biota (Houde et al. 2011). PFAA concentrations in biota are influenced by uptake and elimination of both PFAAs and their precursors, as well as biotransformation rates of PFAA precursors (Asher et al. 2012; Gebbink, Bignert, and Berger 2016). Therefore, concentrations of PFAAs observed in biota at one location may not reflect concentrations in other environmental media.
6.5.1 Plants
Studies show evidence of uptake and accumulation of PFAAs by plants in several settings and applications, including both controlled experiments and field investigations. Concerns about introducing PFAAs into livestock or crops have led to investigations of uptake and accumulation in plants (Section 5.6). Uptake mechanisms and the extent to which native plant species remove and accumulate PFAS have not been as well studied.PFAS may be introduced to plants from soil, water, or air by:
- irrigation water
- the application of biosolids or sludge-amended soils
- the application of pesticides
- soil and groundwater at PFAS sites or near releases of PFAS
- exposure through contact with rainwater and atmospheric deposition
Studies demonstrating plant uptake of PFAAs have focused on irrigated crops (Stahl et al. 2009; Scher et al. 2018; Bolan et al. 2021), crops in biosolids-amended soil (Yoo et al. 2011; Blaine et al. 2013; Blaine et al. 2014; Felizeter et al. 2021; Costello and Lee 2020; Knight et al. 2021), and aquatic plants in constructed wetlands (Chen, Lo, and Lee 2012). PFAS have also been found in pesticides (Zabaleta et al. 2018; Lasee et al. 2022). USEPA’s Analytical Chemistry Branch repeated the analyses conducted by Lasee et al. (2022) for PFAS and conducted additional analyses. In USEPA’s results no PFAS were detected above the method detection limits (USEPA 2023).Other investigations have focused on flora exposed to PFAAs in the natural environment (Zhang et al. 2015) or near known PFAS sources (Shan et al. 2014). Based on bioconcentration factors discussed in Section 5.6, concentrations in plants will generally reflect the same concentrations in soil and, for trees with deep roots, groundwater (Gobelius, Lewis, and Ahrens 2017).
6.5.2 Invertebrates
Invertebrates act as the main component of the food web base and play a key role in the dynamics of biomagnification. Aquatic invertebrates can reside in the water column, as well as on (or in) the sediment substrate. In higher trophic level organisms, PFOS has been documented as the dominant PFAS, with concentrations increasing up the food chain, while PFOA has a lower bioaccumulation potential with similar concentrations among species of different trophic level animals (Houde et al. 2011; Conder et al. 2008). In invertebrates, both PFOS and PFOA have maximum values within similar ranges (Ahrens and Bundshuh 2014). A recent review of PFAS occurrence in marine and estuary invertebrates (i.e., mollusks and crustaceans) found that patterns of PFAS bioaccumulation can vary slightly between these taxa, but historical differences in sampling and analytical methods complicate comparisons to more recent investigations (Giffard et al. 2022). Studies present a PFAS range of approximately 0.1–10 mg/kg in invertebrate tissue, although their sources predominantly address marine organisms (Houde et al. 2011). Similar levels of PFOS have been found in freshwater invertebrates (< 2–4.3 mg/kg) with a BCF (biota/water) estimated at 1,000 L/kg (Kannan et al. 2005). Concentrations of PFOS, PFCAs, and heptadecafluorooctane sulfonamide (PFOSA) have been observed in Lake Ontario invertebrates, ranging from < 0.5 to 280 mg/kg (Martin et al. 2004). The PFAS concentrations in invertebrates were greater than in fish from this lake.
In soil invertebrates, current research indicates that bioaccumulation potential of PFOS is low, as is biomagnification (increasing concentrations in predators over their prey) from lower to higher trophic level organisms (CEPA 2017). In biosolids-amended soils, the mean PFAS BAFs in earthworms have been found to range from 2.2 (PFOA) to 198 (PFDoA) g dry weight (dw) soil/g dw worm (Navarro et al. 2016). Maximum BAFs in earthworms for all PFAS types have been observed at <45 g dw soil/g dw worm for biosolids-amended soils and <140 g dw soil/g dw worm for soils contaminated with AFFF (Rich et al. 2015).
6.5.3 Fish
Accumulation of PFAS in fish is well documented, particularly for PFOS, longer chained PFCAs (with eight or more carbons), and perfluorodecane sulfonate (PFDS) (Houde et al. 2011; Martin et al. 2013; Conder et al. 2008). PFOS generally has the highest concentrations in fish due to the historically high use of this chemical and its bioaccumulation potential (Houde et al. 2011). PFDS, long-chain PFCAs, and other PFAS have also been measured in fish (Houde et al. 2011; Fakouri Baygi et al. 2016).
In fish, PFOS tends to partition to tissues of high protein density, including the liver, blood serum, and kidney (Falk et al. 2015; Ng and Hungerbühler 2013). This distribution pattern is contrary to other persistent chemicals, which tend to partition to adipose tissue. Concentrations of PFOS and other PFAAs tend to be higher in whole fish samples compared with fillets given that a major fraction of PFAAs is found in the carcasses of fish rather than fillets (Fliedner et al. 2018). PFAA concentrations sometimes increase with fish size; however, the relationship with fish size is not consistent as observed for other contaminants such as mercury (Babut et al. 2017; Gewurtz et al. 2014).
Fish data for PFOS collected near known sources (for example, AFFF sites) from some key studies are summarized in Figure 6-5. More information is archived as a Section 17.1 PDF, found under Archived External Tables and Sections on the home page of this site.
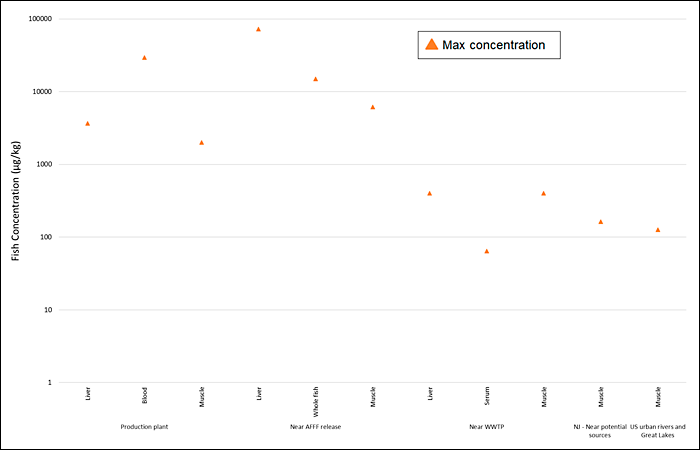
Figure 6-5. Observed PFAS concentrations in fish.
6.5.4 Vertebrates
Most research addressing PFAS concentrations in vertebrates focuses on temporal trends in animals at the top of the food chain, such as piscivorous birds (for example, osprey) and mammals (for example, dolphins, seals). The concentrations are often reported in protein-rich organs known to concentrate PFAS. For example, to evaluate temporal trends between 2002 and 2014, levels of PFAS were measured in liver samples of Indo-Pacific humpback dolphins and finless porpoises (136–15,300 and 30.5–2,720 ng/g dw, respectively) (Gui et al. 2019). Livers of Beluga whales in the Artic were the only organ sampled to better understand the relative bioaccumulation of persistent organic compounds (Reiner et al. 2011). These data using top marine predators as “sentinels” of PFAS are important in terms of assessing whether concentration trends are increasing or decreasing in the global environment.
PFAS bioaccumulation in terrestrial human food sources (livestock, livestock products, and game) is a critical area of occurrence discussions, and few research or review articles currently exist. Animals raised for food and wildlife species may come into contact with PFAS through contaminated air, water, soil, substrate, or feed. However, the extent to which these exposures contribute to PFAS concentrations in food products is not extensively researched (Death et al. 2021). A study focused on livestock drinking water and grazing found that sites with mean livestock drinking water concentrations as low as 0.003 μg PFOS/L may exceed action levels or advisory levels for PFOS in cattle meat (Mikkonen et al. 2023). Current understanding is that most PFAS accumulates in muscle tissue and milk (Brake et al. 2023). Some state agencies are conducting sampling surveys of game animals and issuing “Do Not Eat” advisories (ME DIFW 2023; MPART 2023).
–
Updated January 2026.

