10 Site Characterization
The intent of this section is not to present general site characterization principles, but to highlight unique considerations or examples for this family of emerging contaminants. It is assumed that site characterization will follow all applicable state and federal (for example, CERCLA or RCRA) guidelines. The general principles of site characterization are similar for PFAS as for any contaminant, in that the physical setting, release specifics, proximity to receptors, and fate and transport characteristics will determine the sampling locations and requirements. Because of the toxicity, persistence, mobility, ubiquity, the large number of compounds in this family of chemicals, the variability and uncertainty of specific compounds and their criteria being regulated, and the emerging nature of PFAS, it is necessary to consider specific concerns in PFAS site characterization efforts.
Exposure to PFAS can occur through a variety of transport pathways involving all environmental media, as is described in Section 5. Because ingestion of water is deemed a major route of exposure in humans, and the emerging nature of PFAS as contaminants of concern, regulatory interest has in the past several years been centered on this pathway. In turn, this focus has led to an increased emphasis on investigation of the connection between drinking water sources and groundwater, including direct use of groundwater as drinking water and connections between surface water and groundwater. Because of this regulatory and investigatory focus, this section places more emphasis on characterization of groundwater plumes than characterization of other media. Although groundwater may have in the past been more commonly the initial regulatory and investigatory focus, regulatory focus is broadening to other media such as surface water and biota and as a site-specific characterization process advances data are generally required from one or more other media including soil, sediment, surface water, stormwater, air, biota, or other media depending upon the nature, duration, and time of the release. Section 2.2 includes detailed information about the wide range of PFAS chemistry. Section 4 includes information about physical and chemical properties.
The guidelines below include general considerations for the most common types of PFAS sites. Many of the papers referenced in this section are products of studies sponsored by SERDP/ESTCP. A list of SERDP/ESTCP research projects related to PFAS and AFFF can be found at https://www.serdp-estcp.org.
10.1 Site Characterization Issues Relevant to PFAS
The Priority Topics for Fate and Transport, Surface Water, Source ID, and Site Characterization include information about site characterization tools and techniques (see Section 1.3.8).
Historical investigations may have missed the potential for PFAS contamination at a site because, until recently, these chemicals were not regulated, were not considered a health or environmental concern, or PFAS sampling and analytical procedures may not have been available. As a result, PFAS plumes had years to develop and migrate without detection or characterization. Reviewing available site information such as a timeline for processes, layout, chemical use, release history, and fire training and/or firefighting events when AFFF was used in comparison with the time period of PFAS use can be helpful in evaluating the types and potential occurrences of PFAS releases. Once the potential for a PFAS release(s) is reasonably established, initial sampling could be completed to verify whether PFAS is present. If PFAS is determined to be present at levels warranting further assessment, a site investigation would be completed to characterize the nature and extent of the release and subsequent PFAS distribution. However, a PFAS site may be one of the many without an identified source (ATSDR 2021).
The following are some important considerations specific to PFAS sites.
10.1.1 Evolving Science and Regulations
State of the science: Understanding of many aspects of PFAS, such as toxicology and behavior in the environment, is changing rapidly. This may require reevaluation of earlier assumptions and conclusions throughout the site characterization process.
Analytical methodologies: Analytical methodologies continue to be developed and improved. Specific attention must be paid to a wide variety of factors, such as analytical methods, detection/reporting limits, and parameter lists that are continuing to expand ( see Section 11.2).
Sampling methodologies: Cross-contamination potential may exist due to the presence of PFAS in consumer products; many regulatory agencies require a precautionary approach to sampling prohibiting the use of materials that may be treated with PFAS. See Section 11.1, Sampling, for more details.
Regulatory environment: The regulatory environment remains in flux, with changing regulatory limits, sampling procedures, and compounds of interest. Investigators should review current regulatory requirements to identify impacts to the site characterization (see Section 8, and the Regulatory Programs Summary Excel file).
10.1.2 Source, Fate, and Transport Properties
Sources: PFAS sources are discussed in Section 2.6. AFFF releases are discussed in more detail in Section 3.3. In addition, Salvatore et al. (2022) proposed that PFAS releases to the environment could have occurred at AFFF discharge sites, industrial facilities included in 38 specific North American Industry Classification System (NAICS) codes, and PFAS-containing waste sites. There are also “secondary sources,” such as PFAS concentrating into one portion of a plume (for example, groundwater into surface water) that then acts as a source to further groundwater contamination.
Further, because of the large number and varying chemical and physical properties of PFAS, and widespread use of PFAS-containing products, there may be multiple locations that act as a source of PFAS at a site. In addition, PFAS are often detected at low levels in samples from locations without any apparent or nearby sources. In those instances, there may be a need to evaluate the site-specific anthropogenic ambient background concentrations and determine their contribution to PFAS concentrations in environmental media at a site. See, for example, Strynar et al. (2012).
The Priority Topics for History, Use, and Naming Conventions include information about semiconductor industry uses of PFAS (see Section 1.1.1), less-publicized PFAS Sources (see Section 1.1.2), and less-studied PFAS (see Section 1.1.3), including ultrashort PFAS, cyclic PFAS, volatile PFAS, and fluorinated gases. The Priority Topics for Biosolids Land Application (See Section 1.7) include information that supplements the biosolids information in Section 2.6.4. See also the PFAS and Vapor Intrusion Fact Sheet developed in 2025. The Priority Topics for PFAS and Microplastics provide information about the interconnections between PFAS and Microplastics (see Section 1.8).
Secondary Sources
Sources created through movement of contaminated media into an area that was previously uncontaminated (for example, contaminated water from irrigation wells or reuse and application of biosolids, or atmospheric deposition) or an area where physical or chemical processes have concentrated PFAS, resulting in an additional source (for example, multi-media interfaces; see Sections 5 and 6).
Pathways: PFAS may be present or migrate via pathways that are not typically observed with other compounds. For example, PFAS may be present in groundwater at a site via air deposition and no direct on-site release.
Complex transitions between media: The behavior of PFAS in the environment may deviate greatly from typical contaminants. Transitions between media may be complex because of specific characteristics of these compounds. For example, PFAS may disperse more upon reaching the water table than is typical for most other compounds, or a groundwater plume discharging into a surface water body may infiltrate into groundwater elsewhere, with contamination in the surface water acting as a secondary source. See Sections 5 and 6 for additional detail.
Partitioning: Because of their physical and chemical properties and the variability of those properties, certain PFAS may partition from water through different mechanisms (including hydrophobic effects, electrostatic interactions, and interfacial behaviors) to other media or forms, including air, micelles, foam, solids, NAPL, and interfaces between these phases. Physical and chemical properties are discussed in more detail in Section 4 and phase partitioning is discussed in more detail in Section 5.2 and as appropriate in several subsections in this section.
Site-Specific Anthropogenic Ambient Background
Concentrations of PFAS present in environmental media at the site that are not the result of or influenced by site activities or releases.
10.2 Initial Steps
A comprehensive initial assessment commonly starts with developing an understanding of potential PFAS uses in the area; history of the site operations that potentially used PFAS-containing materials; areas where fluorine-containing Class B firefighting foams were stored, used, or released; on-site or off-site air deposition patterns where PFAS may have been produced or processed (for example, manufacturer and/or industrial facilities that produce PFAS or use materials containing PFAS and are likely to have airborne emissions), and the regional geologic and hydrologic framework as it relates to contaminant transport to surface waters or drinking water wells. Following the initial assessment, several phases of site investigations may be required at a sufficient resolution to capture the effects of the heterogeneities that direct contaminant distribution, fate and transport, and remediation effectiveness. However, there may be a need to prioritize the evaluation of certain exposure pathways (for example, drinking water wells) during the beginning investigations to quickly assess potential human exposures and because of constraints on resources and schedule.
When historical PFAS releases have occurred upgradient of drinking water sources, drinking water sampling may be the first indication that there is a problem. In areas where there is a concern that a PFAS source may be present, identification and sampling nearby drinking water sources (for example, groundwater and surface water) have in certain circumstances preceded typical site investigation work and can be considered in future situations to determine if PFAS are present in potable water sources and evaluate the potential exposure to human receptors. In cases where sources are not well defined, reconnaissance sampling may be useful to inform the development of the conceptual site model (CSM) and site investigation. Prior to further site characterization, proper notification to consumers and evaluating options to reduce or eliminate PFAS exposures, including alternative drinking water sources, may be required. In cases where sources are not well defined, reconnaissance sampling may be useful to inform the development of the CSM and site investigation plan.
CSMs are useful tools for the presentation and evaluation of site characteristics, releases, contaminant fate and transport, and exposure pathways, and it may be appropriate to develop an initial CSM prior to or as a part of preparing a site investigation plan. Generalized CSMs are presented in Figures 9-1, 9-2, and 9-3. The referenced CSMs present most known and potential PFAS source areas, transport mechanisms, and pathways on a simplified physical setting. The CSMs also illustrate exposure routes and receptors.
CSM development is an iterative process over the project life cycle with information obtained during site investigation, remedy design, remedy implementation and optimization, and post-remedy monitoring (if applicable). Similar to the USEPA’s data quality objectives (DQOs), it relies on a systematic objectives-based site characterization process (ITRC 2015). The CSM for a PFAS site is developed with information on potential ecological and human receptors, and PFAS sources and releases (whether occurring on site or off site from groundwater, surface water, sediment, or air), and should be updated as new information becomes available through site characterization, evaluation of all pathways, and potential receptors. Because many PFAS sites have had releases of other contaminants and subsequent follow-up site investigations, it is possible that a CSM may exist for the site that could serve as the basis for modifications to address PFAS.
10.3 Site Investigation
This section highlights some important considerations for site investigation that are relevant for PFAS. The general principles of site investigation are similar for PFAS as for any chemicals. In 2024, USGS published a guidance that reviews a broad range of considerations for site investigation and sampling in the context of Natural Resource Damage Assessment and Restoration (Pulster et al. 2024).
10.3.1 Development of Site Investigation Work Plan
PFAS investigation work plans should take into consideration the information provided in this guidance document (for example, Sections 2, 4, 5, 6, 9, and 11), including items such as sampling procedures and equipment to prevent cross-contamination, analytical methods, compounds to be reported, quality assurance/quality control, geographically variable and changing regulatory requirements and criteria, site-specific environmental setting, human health and/or ecological risk assessment, and potential treatment technologies and remedial approaches (see Section 12). From a general perspective the work plan will depend on the type of PFAS source and subsequent transport via various media, both of which should be discussed in the CSM section of the work plan. Investigative approaches should consider potential nearby sources and secondary sources, such as irrigation, sludge, or biosolids applications; atmospheric deposition; landfill leachate; and wastewater treatment plant discharge. As noted below, it is critical for the investigation to generate data that directly support subsequent risk assessments, feasibility studies, EE/CAs, and/or other evaluations of potential remedial alternatives. For PFAS, this may require a relatively high data collection effort, given typical release scenarios (for example, as a mixture of different PFAS) and low criteria values, and require more than one phase of investigation.
10.3.1.1 Geologic and Hydrogeologic Investigation
Evaluation of the geologic and hydrogeologic framework associated with the site is critical, and sometimes that framework may need to be addressed on a regional basis, as the PFAS impacts may extend significant distances from the site.
The amount of information to be collected to complete an adequate assessment is a site-specific determination based on many factors, such as complexity of stratigraphic and lithologic variability, project objectives, and available budget. In development of a work plan, consideration should be given to understanding the geologic history and geomorphology of the site and to evaluating how the subsurface materials and geometry control the fate and transport of contaminants. High-resolution site characterization (HRSC) techniques are normally appropriate to obtain adequate subsurface information (for example, grain size, lithological interfaces, and high transmissivity zones) to complete stratigraphic assessments (USEPA 2016). ITRC has guidance on implementing advanced site characterization tools (ITRC 2019).
Environmental sequence stratigraphy (ESS) is also an approach that may be applicable depending on site-specific circumstances. ESS is a method for understanding the geologic framework and related subsurface contaminant transport pathways, both regionally and underlying a site. The ESS approach is presented in USEPA Groundwater Issue Paper “Best Practices for Environmental Site Management: A Practical Guide for Applying Environmental Sequence Stratigraphy to Improve Conceptual Site Models” (USEPA 2017). A case study describing the use of ESS for PFAS investigations is described in Section 15.1.3.
The geologic and hydrogeologic investigation should define the hydrogeologic and geochemical parameters that are pertinent to PFAS migration and applicable to subsequent remedial actions. A thorough understanding of site soil types (for example, foc, bulk density, surface charge, anion and cation exchange capacity, grain size, minerology, and water content) and geochemistry (for example, ionic concentrations, ionic strength, dissolved oxygen, oxidation-reduction conditions, and pH) is needed to assess PFAS transformation, partitioning (including desorption), and migration in groundwater or soil. Hydrogeologic parameters such as groundwater recharge, hydraulic gradient, infiltration rate, permeability, hydraulic conductivity, and seepage velocity are vital components of the site investigation and help define the potential migration rate of PFAS. A thorough evaluation of the site hydrogeology will aid in evaluating and designing remedial alternatives. For example, the site geochemistry, including cations, anions, total dissolved solids, and fouling parameters (for example, iron, manganese, hardness, biochemical oxygen demand (BOD)), as well as other organic compounds in groundwater, may have a significant impact on the selection, design, and implementation of potential groundwater remedies.
Similarly, understanding the range of concentrations of PFAS in varying soil types and PFAS distribution in the vadose zone compared to the saturated zone is an important objective of site characterization. At sites with soils of varying permeabilities, the PFAS distribution within these different soil types should be established to better understand the feasibility of various remedial options, such as those that involve amendment distribution within the subsurface. This type of information is also beneficial for documenting natural processes that may be contributing to retention of PFAS within source areas and influencing downgradient transport.
10.3.1.2 Surface Water Body Secondary Sources
Because certain PFAS are mobile and resistant to breakdown in the environment, there have been cases of surface water creating very large dilute groundwater plumes through recharge (ATSDR 2008). Infiltration of PFAS along the course of surface water systems, including tidal zones, may result in widespread secondary sources to groundwater, further enlarging the contamination area (Ju et al. 2008). A study assessing PFAS concentrations in river and groundwater from several locations found that concentrations and trends in groundwater were generally similar to those observed in surface water, suggesting the aquifer was contaminated with the same source as the surface water (Sharma et al. 2016). Areas with high hydraulic conductivity allow for the rapid spreading of PFAS over large areas. However, even in lower permeability geologic deposits, PFAS contamination is a problem because the combination of long groundwater residence times and persistence of most PFAS results in a long-time presence of these compounds in water resources (Banzhaf et al. 2017). In situations where PFAS-contaminated surface water is recharging groundwater, investigation of the potentially impacted groundwater should be conducted to fully characterize site-related contamination (Divine et al. 2023). Complicating surface water being a secondary source is that PFAS have been shown to concentrate at the surface water-air interface (Ju et al. 2008). PFAS contamination may also concentrate in naturally occurring surface water foam (due to an affinity to organic material in the foam and the higher PFAS concentrations at the surface water-air interface where the foam is formed). Therefore, site characterization must consider whether or not surface water bodies are the most downgradient extent of contamination. Section 5.3.4 includes information on transfer of PFAS between surface water, sediment, and groundwater, including how changing conditions in the hyporheic zone are likely to affect PFAS transformation and partitioning. A brief discussion of surface water–groundwater interactions extending the areal impact of PFAS contamination is discussed in a case study in Section 15.5, and surface water quality is discussed in Section 16.
When evidence suggests that PFAS contamination is being transported between surface water and groundwater, it may be important to identify site-specific conditions of the hyporheic zone and to quantify PFAS concentrations in sediments or porewater, mass flux between groundwater and surface water, and factors such as redox conditions, salinity, and composition of sediment or suspended particulates (organic and mineral content) that may affect PFAS sorption and transformation (see Sections 5.2.3 and 5.3.4).
PFAS levels in sediments can be an expression of the average deposition conditions of discharges that are episodic. Sampling of sediments on a dry-weight basis provides information on PFAS sorbed to sediments, but may underestimate or miss PFAS in mobile porewater, which makes passive porewater samplers practical tools to characterize the concentration and mass flux of PFAS in or across the hyporheic zone and correlate it with the sediment PFAS content. Some types of passive samplers allow accumulation of contaminants over time, thus generating a time-weighted mean concentration rather than a snapshot of concentration at a discrete time point as given by discrete porewater sampling. Therefore, depending on study objectives, passive sampling may provide data that are more representative of PFAS mass flux between surface water and groundwater as compared to sediment sampling or discrete porewater sampling. However, careful consideration of study objectives must be given when selecting the type of passive sampler, as equilibrium devices may not be appropriate for measuring episodic discharges. See Sections 11.1.7.4 and 11.1.7.7 for more information on porewater and sediment sampling for PFAS, respectively.
10.3.1.3 PFAS-Specific Tools for Site Screening or Characterization
Investigative techniques to characterize source soils and determine the three-dimensional extent of soil and groundwater contamination should be considered. HRSC technologies, while providing near real time subsurface lithological and hydrologic information, can be used to efficiently obtain discrete groundwater samples in the intervals of interest, such as the high transmissivity zones and lithological interfaces. Analytical procedures that can be used in a mobile laboratory and achieve ng/L detection limits are becoming more available and can be used on site in conjunction with discrete HRSC sampling techniques (Quinnan et al. 2021). Use of a mobile laboratory can be expensive and is cost-effective only in specific situations when a sufficient number of samples can be collected in a short time period to keep the mobile laboratory at or near its capacity. Use of a mobile laboratory and the quick turnaround of results they provide allow for adaptive selection of additional sampling locations for delineation or other objectives. One of the main drawbacks associated with current field-screening methods is the inconsistency of results associated with measurement sensitivity to site-specific factors, including varying soil types and compositions. Furthermore, field screening methods should not be anticipated to replace fixed-laboratory analysis in terms of satisfying regulatory requirements.
Other field-screening methodologies have either been tried or are in the research and development phase, including ion selective electrodes to quantify PFOS and a mobile field-screening unit for PFOS and PFOA, both of which are attempting quantification to ng/L levels (Deeb 2016). Another method in the development stage is “a synergistic approach for the targeted affinity-based capture of PFOS using a porous sorbent probe” (Cheng et al. 2020) that may be able to obtain a detection limit for PFOS in water at about 0.5 ng/L. Rodriguez et al. (2020) provided a review of PFAS-detecting sensors and expected future direction for sensors. Multiple technologies for PFAS site investigation including passive and no-purge samplers, passive flux meters, mobile labs, real-time sensors, and novel techniques for reliable detection in complex matrices have been recently reviewed (Horst et al. 2022).
10.3.2 Nature of PFAS Sources
The Priority Topics for Fate and Transport, Surface Water, Source ID, and Site Characterization include information about characterizing PFAS in groundwater at or near facilities with septic systems (see Section 1.3.2).
The nature of primary and secondary PFAS sources at a site will largely determine the extent of PFAS contamination at the site. Multiple factors may contribute to the nature of PFAS sources at a site. Key factors to consider in development of a work plan include:
- Leaching from the vadose zone to the saturated zone: PFAS present in unsaturated soils due to retention mechanisms (for example, partitioning at the air/water interface and sorption to organic matter) are subject to downward leaching during precipitation or irrigation events (Section 5.2).
- Matrix diffusion: PFAS dissolved in groundwater that diffuses from higher permeability zones and accumulates in lower permeability silt/clay layers below the water table and may diffuse back into the higher permeability zones due to changing relative concentrations (Section 5.3.1).
- Desorption: PFAS resulting from desorption from solids in the vadose or saturated zones and resolubilizing in porewater or groundwater could occur when adsorption (that is, partitioning) is reversible (Milinovic et al. 2015); such desorption would have the effect of sustaining PFAS concentrations in porewater or groundwater.
- Nonaqueous phase liquids (NAPL) dissolution: PFAS entrained in NAPL in the subsurface may be associated with releases of chlorinated solvents and/or petroleum hydrocarbons.
- Other sources: Given the widespread use of some PFAS, additional sources upgradient or within a plume may be contributing to PFAS concentrations at a site. Collecting samples to allow for evaluation of anthropogenic ambient background and/or commingling of plumes may be necessary if it is suspected that other sources are a contributing factor.
- Atmospheric deposition: PFAS are sometimes associated with stack or other air-emission sources and may contribute to regional PFAS concentrations.
- Overland runoff: Runoff and stormwater conveyance systems can impact surface water locations downstream of the actual source or groundwater along the course of the conveyance system.
- Groundwater discharge to surface water or surface water recharge of groundwater: Gaining or losing surface water body (for example, rivers, streams, lakes, ponds, impoundments, and wetlands) conditions may influence the extent of a plume. Discharge or recharge (seepage) rates and directions may change seasonally, with extreme weather events, or during periods of drought or precipitation.
- Subsurface features, including utility lines: Preferential pathways may result from subsurface features. For example, flow may seep into or out of nonwatertight sewer lines based upon groundwater elevations relative to the utility. The bedding material of a subsurface line may also convey groundwater.
- Multicomponent mixtures: At some sites, numerous PFAS may be present in one or more source zones. Mixtures may be present for several reasons, including, but not limited to, the following: multiple sources, varying time frames, and a mixture of compounds introduced during production (Sections 5 and 10.5).
- Precursors: Delineating, as practicable, the extent of precursors that may degrade to PFSAs and PFCAs will help the investigator understand sources and potential long-term concentrations.
10.3.3 Extent of PFAS
As with other chemicals, a site investigation for PFAS relies upon understanding the nature of sources as well as the lateral and vertical extents. A PFAS release can be localized or highly extensive, both horizontally and vertically. The extent is a function of many factors, such as site conditions, the nature of the PFAS source, transformation of precursors, and the relevant migration pathways. For example, some PFAS may be highly mobile in groundwater and some PFAS plumes may have had many years to develop and could consist of many compounds that are not expected to degrade, as discussed above. Therefore, PFAS plumes could be larger or deeper than expected, although there are currently limited quantitative data on PFAS plume lengths or depths in groundwater as compared to other contaminants. Sufficient delineation of PFAS extent in groundwater requires a monitoring well network with wells located throughout the plume (for example, source area, midplume, distal end, side-gradient, and clean sentry wells to define the plume boundaries). Such a well network will provide data to evaluate dissolved phase migration, potential precursor transformation trends, and/or plume stability.
Detailed vertical delineation as a component of HRSC should consider soil sampling at predetermined depths and distinct lithologic units within the vadose zone, the zone of water table fluctuation, and beneath the water table to a depth necessary to determine the vertical extent of impacts. In addition, consideration should be given to groundwater sampling of all saturated units to an appropriate depth. Collection of these data may necessarily be an iterative process requiring more than one phase of investigation to determine the vertical extent of PFAS impacts. This information is beneficial for evaluating potential accumulation points, matrix diffusion potential, varying groundwater conditions, and risk assessment, and to support remedial alternative evaluation.
At sites where PFAS has been released to the subsurface and reached groundwater, the velocity of groundwater movement (advection) is a key consideration for understanding plume migration potential, as well as those processes that act on PFAS during advective transport (for example, sorption, diffusion). At some sites, more mobile shorter chain PFAS have been observed to extend relatively farther in groundwater than longer chain PFAS due to less retardation in groundwater. The partitioning behavior of PFAS is discussed in Section 5.2.
Another factor in the extent of PFAS at mature sites is prior remediation intended to address other contaminants. For example, groundwater pump and treat systems designed and operating to address other contaminants may have partially captured PFAS or their discharge may have spread PFAS. Other remediation methods such as oxidation may result in a change in the relative concentrations of individual PFAS (for example, oxidation of precursors).
Depending upon site-specific conditions, several pathways need to be considered to assess potential upgradient sources. PFAS migration in air from industrial or commercial sources can influence soil or groundwater a great distance from larger sources (Section 6.1), for example, see Barton (2010) and Shin et al. (2011). Data from urban soils and groundwater indicate that for sites near metropolitan areas, there may be measurable contributions of PFAS from other sources, unrelated to site-specific sources, see the site-specific anthropogenic background text box in Section 10.1.3 and Xiao et al. (2015).
Commingling of contaminants has a potential to impact PFAS extent (note that PFAS commingling with other contaminants could also affect several other facets of a site characterization and/or risk assessment). For example, for PFAS sites associated with industry, fire training, or emergency response that have a chlorinated solvent or other NAPL source, investigators need to consider potential effects on PFAS in the subsurface and related data collection requirements. Laboratory studies have demonstrated that sorption or partitioning of PFAAs may increase in the presence of trichloroethene DNAPL in bench-scale tests (McKenzie et al. 2016). Conceptual modeling of published PFAS data suggests that NAPL-water partitioning and NAPL-water interface interactions may significantly increase retardation of some PFAS in source zones (Brusseau 2018; Brusseau 2019; Brusseau et al. 2019, 2019; Costanza, Abriola, and Pennell 2020; Lyu and Brusseau 2020; Schaeffer et al. 2019; Silva, Šimůnek, and McCray 2020; Sima and Jaffe 2021). These enhanced attenuation processes are discussed in Section 5.2.4.1 (partitioning adsorption to air/water interfaces) and Section 5.2.5 (NAPL-water interface). This research suggests that if PFAS and NAPL are present in media that make effective source treatment unlikely—for example, in low-permeability soils or fractured rock—that fraction will represent a long-term contributor to groundwater plume persistence. At older sites where in situ (for example, oxidation) or pump and treat methods have been employed to reduce NAPL source areas prior to awareness of PFAS, those remedies may complicate characterization and distribution of PFAS. Depending upon the method employed, mobilization of some PFAS may have changed following treatment, and remedial actions may affect distribution and relative concentrations of individual PFAS (McKenzie et al. 2016; McGuire et al. 2014).
At most sites where PFAS is present in groundwater, the extent of PFAS contamination is likely to be a key objective for site characterization and used for identifying appropriate remedial options (if warranted). Estimating the plume advancement rate may provide beneficial information for the remedial decision process. For example, a plume that is advancing relatively slowly and without nearby receptors may be more amenable to different remedial approaches, such as in situ sorption or barrier-based approaches (see Section 12.2.4) or other less aggressive techniques (Newell et al. 2022), than plumes that are advancing rapidly towards nearby receptors. Determining plume stability (Section 10.4.8) and/or conducting contaminant transport modeling (Section 10.4.9) provide valuable data for assessing risk and evaluating remedial alternatives.
10.3.4 Investigation-Derived Waste (IDW)
The Priority Topics for Treatment Technologies include considerations for management of PFAS-impacted investigation-derived waste (see Section 1.6.3).
How to handle IDW that contains PFAS is currently a complicated topic, with differing laws and guidance in different states that affect on-site management, storage, labeling, and off-site transportation requirements (ASTM 2024). Investigators must remain vigilant to identify current state and local requirements for IDW generated during site characterization efforts. Site-specific waste handling and disposal plans should be provided in the site’s Health and Safety Plan (HASP), Quality Assurance Project Plan (QAPP), or Sampling and Analysis Plan (SAP) prior to waste generation. During a typical site characterization effort, IDW generated consists of purge water, decontamination water, soil, sediments, solids such as concrete and asphalt, single-use field equipment (for example, bailers, tubing), and personal protective equipment (PPE).
In general, industry has been using two methods to dispose of PFAS-containing solids IDW off-site: landfill disposal and thermal treatment. For liquid wastes containing PFAS, sorption treatment, thermal treatment, or underground injection has been used. On-site treatment of water IDW using existing aboveground treatment systems or temporary mobile units is another option. Treatment conducted on-site can minimize the volume of liquids requiring off-site disposal and may allow treated liquids to be discharged to a publicly owned treatment works or handled off-site as nonhazardous waste. As of March 2023, no PFAS meet the federal definition of a hazardous waste; therefore, most PFAS-impacted IDW is being disposed of as nonhazardous waste.
In 2020, the USEPA published a guidance document, Interim Guidance on the Destruction and Disposal of Perfluoroalkyl and Polyfluoroalkyl Substances and Materials Containing Perfluoroalkyl and Polyfluoroalkyl Substances, Version 2 was published in 2024 (USEPA 2020, USEPA 2024). This interim guidance document outlined IDW that contains PFAS, destruction and disposal technologies currently available and in use, considerations for vulnerable populations that live near these destruction and disposal sites, and current research on this topic. Its focus is on providing options that have the potential to destroy the C-F bonds (thermal treatment) or that control migration of PFAS (with landfilling or underground injection).
Several guidance documents exist for managing PFAS-impacted IDW at U.S. Department of Defense (DOD) installations, including U.S. Army, U.S. Navy, and U.S. Air Force sites. Therefore, any PFAS-impacted IDW generated from a DOD installation should follow the associated required procedures (USDOD 2018; USDOD 2020; USDOD 2020). State or local requirements may be more restrictive than the DOD guidance.
10.3.4.1 IDW Options
Thermal Treatment
Thermal treatment is a broad category that includes several heating technologies: hazardous waste combustors, nonhazardous waste combustors, carbon reactivation units, and thermal oxidizers. Incineration specifically has come under scrutiny recently for its potential to affect communities adjacent to and downwind of incineration facilities through stack emissions if the PFAS are not broken down completely and data gaps associated with the control of products of incomplete combustion (Schroeder et al. 2021; Stoiber, Evans, and Naidenko 2020; USEPA 2024; Galloway et al. 2020; Vollet Martin et al. 2022). Please note—the definition of “incineration” varies based on different state or federal regulations or guidance.
On April 26, 2022, the DOD issued a memorandum to temporarily prohibit the incineration of DOD PFAS materials, until DOD issues guidance on implementing the USEPA guidance on the destruction and disposal of PFAS. The DOD published a memo with interim guidance about destruction or disposal of materials containing PFAS on July 11, 2023 (USDOD 2023). A follow-up statement was published on July 17, 2023 about additional planning and coordination that is needed before incineration is implemented (USDOD 2023).
On June 8, 2022, Illinois passed a law that bans the disposal by incineration of any PFAS, including, but not limited to, AFFF. Incineration was defined as any burning, combustion, pyrolysis, gasification, or use of an acid recovery furnace or oxidizer, ore roaster, cement kiln, lightweight aggregate kiln, industrial furnace, boiler, or process heater.
Landfill
The practice of disposing of PFAS via landfill works to control contaminants of concern through containment. For PFAS and PFAS-containing materials, hazardous waste landfills or lined municipal solid waste landfills could be viable disposal options if the landfills are willing to accept PFAS IDW. Current landfills can serve as long-term containment sites for PFAS, but they are not explicitly designed to control and hold PFAS and PFAS-containing materials. The ability for landfills to safely contain PFAS and PFAS-containing materials is an active area of research by the USEPA and state regulatory agencies.
Subtitle C (hazardous waste) landfills have a bottom liner and leachate collection system, and have been used to contain PFAS IDW. The utilization of Subtitle D (nonhazardous, municipal waste) landfills to contain PFAS IDW is state-dependent due to the potential for leaching into the subsurface. However, there remain concerns with Subtitle C landfills regarding how to handle the collected leachate. Typically, landfill leachate is disposed and treated off-site at municipal wastewater treatment plants, where the leachate is mixed with wastewater and then treated. However, a landfill that contains elevated PFAS in the leachate presents a difficulty for treatment. In addition, research has found that soluble PFAS with high vapor pressures can be emitted into the atmosphere via the gas generated at landfills (Ahrens et al. 2011; Hamid et al. 2018; Wang et al. 2020; Weinberg, Dreyer, and Ebinghaus 2011). This is an active area of research. Due to these concerns, not all Subtitle C landfills will accept PFAS wastes.
Deep Well Injection
Underground injection could be an option for liquid PFAS IDW. Disposal using this technology occurs under USEPA’s underground injection control (UIC) regulations.
The UIC regulations give the USEPA the authority to permit the disposal of PFAS and PFAS-containing liquid IDW in Class I underground injection wells. Class I wells in either the nonhazardous or the hazardous waste categories are designed to dispose of and isolate liquid PFAS and PFAS-containing IDW. Class I underground injection wells are deep injection wells that inject the liquid of concern into a stable geologic formation below the lowermost underground sources of drinking water (USDW).
Underground injection to Class I nonhazardous and hazardous waste wells reduces the risks associated with surface-based disposal methods by avoiding a potential discharge of liquid IDW to surface and shallow groundwater and generating little to no air emissions of PFAS. Class I wells must be sited in areas that are geologically stable without the presence of natural fractures and faults that could allow the injected material to migrate into USDWs (DeSilva 2019; Marine 2020; McCurdy 2011; USEPA 2001; USEPA 2015).
Other/Developing Technologies
Additional methods, and methods in development for disposing of PFAS and PFAS-containing materials, are discussed in Section 12, including in situ and ex situ disposal methodologies for both soil and liquid PFAS and PFAS-containing IDW.
10.3.4.2 Other Considerations
PFAS IDW may also contain other commingled nonhazardous or hazardous substances. This will impact the options available for handling and disposal and should be considered during the project planning process. Of particular concern are wastes from sites where incineration of PFAS is not permitted that have co-contaminants usually disposed of through incineration (such as Toxic Substances Control Act wastes). In these cases, site managers may need to weigh the site characterization needs against the IDW disposal requirements and avoid generation of co-contaminated wastes.
10.4 Data Analysis and Interpretation
There are a number of approaches, methods, and tools available for analyzing and interpreting site characterization data from a wide range of contaminated sites. Examples of approaches, methods, and tools that may be relevant to PFAS sites are described below, but site-specific objectives and characterizations should be considered when determining an appropriate approach.
10.4.1 Vadose Zone Leaching
The Priority Topics for Sampling and Analysis include updated information about leaching methods (see Section 1.5.1). The Priority Topics for Fate and Transport, Surface Water, Source ID, and Site Characterization include information about vadose zone characterization and transport (see Section 1.3.1).
Recent research has illuminated the complexities of PFAS fate and transport in the vadose zone. The majority of this work has focused on lab-based or modeling studies, with an effort to understand how PFAS surfactant properties can enhance or reduce PFAS sorption, in particular at high concentrations such as those encountered at release locations (Sections 5.2.2.2, 5.2.3, and 5.2.4.1). As indicated in Section 5, soil chemistry plays a major role in PFAS fate and transport.
For example, Guo, Zeng, and Brusseau (2020) conducted a sophisticated modeling study indicating that PFOS in the vadose zone at a hypothetical fire training site is primarily sorbed at the air-water interface and only 1–2% of PFOS is in the aqueous phase under the modeled conditions (see Section 5.2.4). This indicates that strong PFOS attenuation may occur in the vadose zone over time, although Guo, Zeng, and Brusseau (2020) showed that eventually there still may be discharge of PFOS to the underlying water table under their modeled conditions. This is consistent with high concentrations of PFOS observed at some fire training sites. Rovero et al. (2021) reviewed literature-reported sorption coefficients (Kd) of eight anionic short (C4)- to long- (C10) chain PFAS, including PFOA and PFOS. Given the broad range in Kd values from 3 to 5 log units, no single value seemed appropriate for estimating PFAS leaching using existing soil-water partition equations. Regression analysis was used to determine if any of the fifteen experimental parameters identified in the literature might be used to predict Kd values. The authors found that none of the values could individually explain variability in reported Kd values, but significant associations existed between Kd and soil calcium and sodium content, suggesting that soil cation content may be critical to PFAS sorption. Organic carbon was found to only be significant at elevated levels (>5%).
Zeng and Guo (2021) developed a three-dimensional model to evaluate the effects of surfactant-induced flow and heterogeneity on PFAS leaching in the vadose zone. Based on simulations using this model, they found that: 1) surfactant-induced flow had little impact on long-term PFAS leaching; 2) subsurface heterogeneity led to preferential flow that results in early arrival and accelerated leaching of PFAS; and 3) acceleration of PFAS leaching in high water-content preferential pathways or perched water above capillary barriers was more prominent than for conventional contaminants due to destruction of air-water interfaces (reduction of air-water interfacial area (Aaw)). The authors of this study also recommended that multidimensional models be used to predict PFAS leaching in heterogeneous soils. Note that these conclusions were based on modeling results, and validation of the results using field data was beyond the scope of the study.
Modeling can be used to try to simulate PFAS transport in the vadose zone; however, it should be performed with careful selection of input values and should note appropriate caveats (see Section 10.4.9). For example, parameters that are important to understanding PFAS leaching processes, such as the air-water interfacial area (Aaw), may be challenging to estimate and/or not adequately captured using current models.
Analytical leaching methods such as the Synthetic Precipitation Leaching Procedure (SPLP) [SW-846 Method 1312 (USEPA 2021)] and the Toxicity Characteristic Leaching Procedure (TCLP) [SW-846 Method 1311 (USEPA 2021)] may be able to provide site-specific insight into the leachability of PFAS from vadose zone materials. The TCLP “is designed to determine the mobility of both organic and inorganic analytes present in liquid, solid, and multiphasic wastes” for waste characterization purposes (USEPA 2021). The SPLP is designed to determine the mobility of both organic and inorganic analytes present in liquids, soils, and waste to evaluate the potential of contaminants to leach into groundwater (USEPA 2021). Therefore, the SPLP is typically used for soils in site characterization contaminant leaching studies and allows for less acidic extraction fluids (simulating exposure to acid rain) than the TCLP test (simulating exposure in a landfill) so it can better represent environmental conditions expected to be encountered at a site. Currently some state agencies include the SPLP test as part of their PFAS assessment guidance, so state-specific guidance or requirements should be verified.
USEPA has also developed a Leaching Environmental Assessment Framework (LEAF). LEAF is a leaching evaluation framework consisting of four leaching tests (SW-846 Methods 1313, 1314, 1315, and 1316), a data management tool, and approaches for estimating constituent releases from solid materials (USEPA 2019). The four leaching tests discussed have been validated for inorganic constituents, but the methods and/or framework may be helpful when evaluating leaching of PFAS in the environment.
Optimizing LEAF leaching tests for use with PFAS is one component of an in-progress SERDP-ESTCP sponsored study: Development and Validation of Novel Techniques to Assess Leaching and Mobility of Per- and Polyfluoroalkyl Substances (PFAS) in Impacted Media, ER20-1126 (SERDP-ESTCP 2021). The project overview states that the study has the overarching goal of developing a framework for evaluation and prediction of the release of PFAS from AFFF-impacted media. Identified specific objectives include: 1) development of a standard leaching assessment methodology for AFFF-impacted media; 2) utilization of approaches including high-resolution mass spectrometry (HRMS), mid-infrared spectroscopy (MIR), and chemometrics to evaluate and develop a predictive model of PFAS sorption and desorption to AFFF-impacted media; and 3) comparison of results of laboratory testing to leaching and mobility under field-relevant conditions to develop an approach for translation of bench-scale test results to site-scale implications. Other SERDP-ESTCP sponsored studies include ER20-5088, which is evaluating how PFAS leaching is influenced by factors such as the soil to groundwater ratio (PFAS Leaching at AFFF-Impacted Sites: Insight into Soil-to-Groundwater Ratios), and ER18-1389: Baseline Data Acquisition and Numerical Modeling to Evaluate the Fate and Transport of PFAS within the Vadose Zone.
Many studies describe the complexity of soil retention mechanisms for an increasing number of nonpolymeric PFAS. This complexity is due to multiphase retention mechanisms that can include air-water interfacial sorption mechanisms as well as both hydrophobic and electrostatic interactions with the surface chemistry of soil particles (Sima and Jaffe 2021; Sharifan et al. 2021; Guelfo et al. 2021). In addition, studies have demonstrated rate-limiting solid-phase sorption kinetics (Brusseau et al. 2019), nonlinear sorption to both solids and air-water interfaces (Schaefer et al. 2019; Li et al. 2019), and desorption hysteresis (Zhao et al. 2014; Ololade 2014; Schaefer et al. 2021). Solution chemistry effects have also been shown to affect retention processes (Cai et al. 2022). All together, these multiphase retention mechanisms may complicate efforts to accurately predict long-term leaching potential from legacy source zones.
Stahl et al. (2013) completed a study evaluating the behavior of PFOA and PFOS in soil and the carryover from soil to plants. Plant samples and percolated water collected by a lysimeter were analyzed for PFOA and PFOS throughout a period of 5 years. PFOA was found to pass through the soil much more quickly than PFOS, and of the original mass applied, 96.88% of the PFOA and 99.98% of the PFOS was still present in the soil after a period of 5 years. Plants were found to have accumulated 0.001% of the PFOA and 0.004% of the PFOS. Loss through the soil leachate was reported to be 3.12% for PFOA and 0.013% for PFOS.
Given the complexity of estimating the mass discharge of PFAS from vadose soils to groundwater, care should be taken when selecting an approach(es) to estimate PFAS leachability to ensure it is appropriate for the site’s physical environmental setting, and consideration should be given to developing multiple lines of evidence. Further, because of the limitations and uncertainties of the available estimation tools, care should be taken when evaluating and interpreting results. Currently available tools to consider include leaching methods (for example, SPLP or LEAF) as discussed above, modeling as discussed in Section 10.4.9.1, and soil lysimeters discussed below and in Section 11.1.7.5. Applicable regulatory guidance and requirements should also be considered.
Like grab samples, lysimeter samples represent a single-time result, which makes the representativeness of lysimeter results suspect when evaluating impacts to groundwater over a season or from year to year. Suction lysimeter samples are good for qualitative comparisons, but they cannot be used for quantitative analysis unless the variabilities of parameters involved are established (ASTM International 2018).
Collection of porewater data via lysimeters may provide pertinent empirical data for one line of evidence for qualitatively evaluating site-specific leaching of PFAS from the vadose zone to the groundwater. Anderson (2021) completed systematic measurements of porewater PFAS concentrations using lysimeters installed within relevant portions of a site. Mass discharge was estimated by multiplying observed lysimeter porewater concentrations by estimated vadose zone infiltration rates to determine the mass of PFAS leaching from the vadose zone to groundwater. However, lysimeter data may be biased by factors such as preferential flow, and samples may not be representative in dry or wet conditions. Isch et al. (2019) completed a study of water and bromide in bare soil using lysimeters compared to field plots and found that the transport of water and bromide in bare soil observed in lysimeters could not be directly compared to their transport observed in field plots. Radolinski et al. (2022) completed a study using lysimeters of how preferential flow alters solute mobility in soils and found that there was “evidence that (1) bypassing water flow can select for compounds that are more easily released from the soil matrix, and (2) this phenomenon becomes more evident as the magnitude of preferential flow increases.”
Lysimeters have been suggested as a tool that can be used to measure the mobile mass fraction of PFAS concentrations in soil porewater (Anderson 2021). Lysimeters have been used by researchers investigating transport of AFFF at impacted field sites to benchmark the accuracy of laboratory batch extraction methods (Schaefer et al. 2022; Quinnan et al. 2021) and to understand temporal trends in PFAS concentrations in porewater (Anderson et al. 2022).
Fate and transport processes can have differential impacts on the individual components of chemical mixtures such as PFAS (see for example, Bock et al. 2022). Differences in the fate and transport process affecting chemical mixtures can result in changes in the relative abundance of these components. For example, more easily transported PFAS in a mixture could be preferentially leached in the source area and enriched downgradient. These processes should be considered when evaluating fate and transport, as well as when conducting a forensics evaluation of PFAS. It should be noted that chemical transformations, such as the conversion of PFAS precursors, will also result in changes in the relative abundance of PFAS in a mixture. These processes emphasize the importance of developing accurate estimates to predict the behavior of PFAS, including PFAS behavior in the vadose zone.
10.4.2 Retardation Coefficients and Travel Time in Groundwater
The Priority Topics for Fate and Transport, Surface Water, Source ID, and Site Characterization include updated information about groundwater partitioning, colloidal transport, and groundwater-surface water interactions (see Section 1.3.4).
The time that it takes for a contaminant in groundwater to travel to a particular downgradient location is highly influenced by the groundwater velocity, and the plume extent is further influenced by processes that may act on the contaminant during transport, as well as by physical chemical properties of the contaminant itself (for example, solubility). As an initial step for evaluating PFAS transport, it may be helpful to estimate retardation coefficients for PFAS to evaluate contaminant-specific velocity and travel time in groundwater, particularly for longer PFAS plumes. As discussed in Section 5.2.3, a linear sorption isotherm is typically assumed for PFAS sorption to organic matter in soil, and sorption coefficients. The Physical and Chemical Properties Table (Table 4-1) provided as a separate Excel file presents a range of available organic carbon partitioning coefficients for environmentally relevant PFAS. Hydrophobic, electrostatic, air-water sorption in the vadose zone, and hydrophobic and electrostatic sorption in the saturated zone also play a role in transport mechanisms (Newell et al. 2021).
However, as noted in Section 5.2.3, it is important to evaluate the PFAS present and quantify the fraction of organic carbon for estimating Koc. The current state-of-science supports Koc being reported in relatively broad ranges on a compound-specific basis. Section 4.2.9 presents a discussion of potential limitations in using Koc values as a predictor of sorption and PFAS mobility. It is also important to note that other geochemical factors (for example, pH, presence of polyvalent cations, and electrostatic processes), possible hysteresis, and nonlinear sorption behavior might influence transport across different PFAS concentration ranges, and isomeric differences may impact PFAS sorption to solid phases (Section 5.2.3). Due to the variability of Koc estimates, it may be appropriate to evaluate transport of an individual PFAS using a range of partitioning coefficients. In addition, empirical estimation of site-specific Koc values in different areas of a site (for example, source zone versus downgradient plume) may be necessary if quantification of the retardation coefficient is important to its characterization.
For example, McGuire et al. (2014) described the calculation of site-specific Koc values for various PFCAs and PFSAs at an AFFF-impacted site. These site-specific Koc values were calculated based on seven pairs of co-located groundwater and soil samples, and fraction of organic carbon (foc) measurements at each sampling location. The soil samples were collected near or at the water table, which was about 4.6–6.1 m below ground surface. McGuire et al. (2014) found that there was a range of between one and three orders of magnitude in site-specific Koc values for the PFAAs analyzed. This may reflect the enhanced sorption of PFAS that occurs at the NAPL-water or air-water interface (Brusseau 2018). There may be smaller ranges in Koc values for PFAAs at greater depths below the water table and downgradient of a source zone (where NAPL is not present). When using this type of site-specific Koc analysis method, it is also important that the groundwater samples be representative of conditions where the point soil samples are collected.
As another alternative to the use of Koc values and the assumption of a linear sorption isotherm, in situ or ex situ studies may be used to develop parameters for simulation of PFAS transport. Such studies could allow development of pseudo-constants to use in model simulations. In groundwater, a bulk retardation factor can be estimated by comparing the observed length of a PFAS plume to the distance that groundwater would be expected to travel during the time since the PFAS release occurred. This method provides an estimation and assumes that the release date is known, but it accounts for the multiple processes influencing PFAS migration in groundwater (as opposed to just hydrophobic partitioning to soil organic carbon).
Desorption of PFAS from solids below the water table could occur when partitioning is reversible; such desorption would have the effect of maintaining PFAS concentrations in groundwater. There is uncertainty regarding the extent to which sorption is irreversible and rate-limited versus an equilibrium process (Section 5.2.3). It may be important to characterize the extent and kinetics of desorption that may occur as a result of remedial activities at the site. Assuming equilibrium desorption may result in overestimation of PFAS removal during remediation activities (Sima and Jaffe 2021).
Because retardation coefficients, travel time, and many other fate and transport processes are based on the physicochemical properties of the individual PFAS, these processes may not affect all PFAS in a mixture equally. As predicted for PCBs in Johnson and Bock (2014), in which aggressive physical weathering was simulated, differential fate and transport trends affecting the components of a chemical mixture can manifest as changes in the chemical profile. For PFAS, more easily transported PFAS in a mixture could be depleted in the source area and enriched at the plume front. A simple model demonstrating the effect for PFAS mixtures based on Koc and foc using the RemChlor-MD model (Farhat et al. 2018) from Bock et al. (2022) predicts that these processes can have important ramifications for PFAS forensics.
10.4.3 Matrix-Diffusion
When evaluating fate and transport of PFAS in a groundwater plume, including time frame for remediation of PFAS, matrix diffusion may be an important process to consider (Section 5.3.1). As such, understanding the potential impacts of diffusion on PFAS persistence in natural soils is a topic of ongoing research.
During the characterization of PFAS plumes, it may be beneficial to collect PFAS soil samples from the transmissive zone directly above a silt/clay layer, and at different depths into the silt/clay layer, to evaluate the potential for back-diffusion to be occurring presently or in the future if there is a decline in PFAS concentrations in the transmissive zone (see Parker, Cherry, and Chapman (2004) and Chapman and Parker (2005) for an example of this sampling approach). Using this approach, Adamson et al. (2020) reported that the majority of the PFAS mass at an AFFF release site was associated with lower permeability soils, highlighting the importance of matrix diffusion on PFAS retention.
Diffusion coefficients for PFAS are generally uncertain but are in development using measurements and models (Pereira et al. 2014). Schaefer et al. (2019) calculated aqueous diffusivity values for nine PFAAs; however, prediction of the influence that diffusion from lower permeability material to a flow zone (i.e., back-diffusion) will have on PFAS remediation time frame remains uncertain because the back-diffusion of PFAS from low-permeability materials involves desorption. As discussed above, PFAS desorption may be a rate-limited process, and these rates have a high degree of uncertainty (Sima and Jaffe 2021). In addition, the irreversible fraction of PFAS in low permeability materials is uncertain at this time. Therefore, the uncertainty associated with modeling remediation time frames of PFAS back-diffusion should be noted. Further discussion of matrix diffusion modeling is included in Section 10.4.9.
10.4.4 Mass Flux/Mass Discharge
The Priority Topics for Fate and Transport, Surface Water, Source ID, and Site Characterization include information about using mass flux analysis for understanding PFAS migration in groundwater and potential discharge to surface water (see Section 1.3.8.2).
Mass flux and mass discharge can be valuable metrics for CSMs and understanding PFAS transport and supporting remedy selection. ITRC (2010) presented a variety of methods available for estimating mass flux and mass discharge, including the use of multiple transects of temporary or permanent monitoring wells across the width of a plume. Even simple methods such as chemical isoconcentration maps are suitable for developing an initial order of magnitude estimate for mass discharge. Calibration of solute transport models is another method that may be used to estimate the mass discharge of PFAS from a source zone, at a point in a plume, or to a surface water body. In addition, mass discharge estimates may be useful for understanding PFAS exchange between groundwater and surface water (Divine et al. 2023), and PFAS retention at the air-water interface could be an important fate and transport process (see Section 5.3.2) and may be considered when estimating the mass discharge from the vadose zone soils to groundwater. See Section 10.4.1 for additional discussion of leaching that should be considered when estimating mass discharge from the vadose zone to groundwater.
Changes in mass discharge over time, as well as changes in mass discharge with distance from a source, can be used to assess attenuation/retention (see Section 10.4.5; Newell et al. 2021). At sites where multiple sources are present, it could also be used to identify the relative contribution of different sources for prioritization purposes (see Section 10.4.5). Note that it may be challenging to estimate the relative mass flux contribution of different sources where low PFAS concentrations are present in porewater and groundwater. In addition, it is important to consider the potential for increases in dissolved mass flux of some PFAS due to biotransformation reactions, desorption between transects, and/or spatially varied infiltration.
10.4.5 Contributions from Different Sources
The potential impact to a site from multiple sources, particularly in proximity to urban or developed locations, needs to be accounted for when assessing site data or identifying data gaps. Each source then needs to be assessed in terms of its specific contributions, and their relative importance or magnitude. Although there are no naturally occurring background levels of PFAS, it may be important to gain an understanding of the Site-specific anthropogenic background (see the text box in Section 10.1.2) concentrations that may be present at a site, as these can have significant implications for site characterization, assessing exposures, evaluating ecological and human health risks, and establishing site action and cleanup levels. Most states have guidance on how to establish site-specific background concentrations for their regulated contaminants.
Tools available to quantify relevant contributions from different types of sources are discussed below.
10.4.5.1 Atmospheric Deposition
Certain PFAS may be present in ambient air and may be elevated near sources such as landfills, WWTPs, fire training facilities, and manufacturing plants (Section 2.6). Many PFAS exhibit relatively low volatility; however, airborne transport of some PFAS can be a relevant migration pathway for some industrial releases. Sections 5.3.2 and 6.1 provide an overview of transport of aerosols and particulates via air. To assess relative contributions from atmospheric sources, air sampling for PFAS can be conducted. Additionally, air dispersion models, such as AERMOD or Industrial Source Complex (ISC3) Model, can be employed to estimate airborne PFAS concentrations and total wet and dry deposition rates at designated receptor locations. Examples where AERMOD could be beneficial during site characterization activities include sites with no obvious source area and sites in industrial areas with multiple potential sources of airborne PFAS. See Section 2.6 for additional details on the most typical PFAS source scenarios.
10.4.5.2 Upgradient Site Contributions
Alternate Sources
Sources that may exist within, upgradient of, or near a site under investigation, that are distinct from the PFAS source being investigated.
PFAS persistence in the environment and their use in a multitude of industrial processes and commercial products result in potential for nonsite-related inputs, similar to other mobile contaminants (Figures 9-1, 9-2 and 9-3). Assessment of potential upgradient site inputs is recommended. The very low health advisory criteria for groundwater only increase the potential importance of identifying what might otherwise be considered “minor” upgradient sources and may result in alternate source identification (Sections 10.3.2 and 10.5). As part of site investigation of an air deposition release, soil data can be statistically compared to background samples, evaluated for vertical stratification, and assessed for spatial distribution relative to the potential source. Groundwater data from the site may be compared to data from other locations using cluster analysis (i.e., a data analysis technique that explores the naturally occurring groups within a data set, which are known as clusters) to assess whether there was evidence of other source terms, or if the site in question appeared to be the sole source.
10.4.6 Transformation Pathways and Rates
The Priority Topics for Fate and Transport, Surface Water, Source ID, and Site Characterization include information about PFAA precursor biotransformation (see Section 1.3.3).
As discussed in Section 5.4, the transformation of precursors may result in increasing concentrations of PFAAs such as PFOS and PFOA along the flow path of a dissolved plume. Transformation reactions may occur due to aerobic biological or chemical oxidation. For example, McGuire et al. (2014) concluded that infusion of dissolved oxygen to bioremediate hydrocarbons downgradient of a former burn pit also likely caused the transformation of precursor compounds to PFAAs such as PFHxS. Some methods that may be used to assess the degree to which transformation is affecting PFAS plume extent and stability include:
- plotting concentration isopleths for precursors and various PFAAs, for example, McGuire et al. (2014)
- use of the total oxidizable precursor (TOP) assay to identify whether precursors are present that may be available for transformation to PFAAs at a point in the plume (Section 11.2.2)
- assessment of ratios of precursor and daughter product species at monitoring wells situated along the centerline of a plume, or the ratio of various PFAAs in various portions of a plume. For example, McGuire et al. (2014) plotted an isopleth map for the ratio of PFHxS to PFOS to show that in areas where dissolved oxygen was injected this ratio was as high as 50, and in other areas where bioremediation was not conducted this ratio was less than 1.
- use of concentration trends along a plume centerline and quantitative methods described in USEPA (1998) to estimate precursor transformation rates
- use of concentration trends along a plume centerline for precursors identified using high-resolution analytical techniques (see Section 11.2.2.5) to evaluate if transformation to presumptive intermediates and end products is occurring during plume transport (Nickerson et al. 2020)
- calculating the site-wide mass of precursors remaining vs. mass of PFAA end products (PFAAs) to estimate the time-averaged transformation rate since the time of release
- groundwater modeling to demonstrate that the relative plume lengths of different PFAAs with different retardation coefficients can be explained only through the transformation of precursors, for example, McGuire et al. (2014).
- a literature review to identify potential precursor transformation mechanisms and evaluate whether site geochemistry and redox conditions are favorable for the occurrence of these mechanisms.
Another method that may be used to illustrate the occurrence of these transformations is radial diagrams. See the case study in Section 15.1.1.
Figure 10-1 shows three radial diagrams based on data from an AFFF release site (McGuire et al. 2014). Each radial diagram compares groundwater concentrations at a monitoring well within the oxygen infusion zone to concentrations at a well approximately 76 m upgradient. The radial diagram shown at the left of Figure 10-1 compares concentrations for five PFCAs between these two wells; the middle diagram shows concentrations from the TOP assay conducted using samples from each well; and the radial diagram on the right compares concentrations for four PFSAs.
These radial diagrams illustrate that oxygen infusion into groundwater likely stimulated the production of mainly PFHxA, PFPeA, PFHxS, and PFBS. The middle radial diagram shows that the difference in TOP assay results between the upgradient well and the well in the oxygen infusion zone does not explain the large PFAAs concentration increases that were observed at the well in the oxygen infusion zone. The TOP assay results were low at both wells throughout the area. This suggests that desorption and subsequent transformation of precursors were occurring within the oxygen infusion zone. These radial diagrams are also useful for evaluating relative concentrations of various PFAAs at each monitoring well. The use of radial diagrams for additional types of trend analysis is discussed further in Section 10.4.9.4.
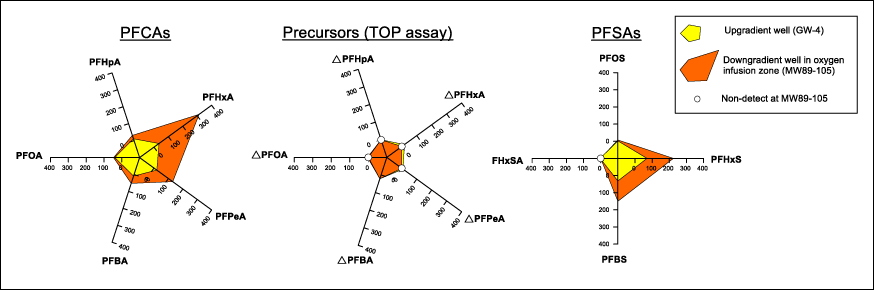
Figure 10-1. Radial diagrams showing the production of various PFAAs in the vicinity of an oxygen infusion zone at an AFFF release site remediated for hydrocarbons in groundwaterSource: G. Carey, Porewater Solutions. Used with permission.
10.4.7 Assessing Retention, Migration, and Attenuation Processes
The degree to which PFAS are retained, migrate, and/or attenuate in site media has significant implications for site remediation and management. Migration of PFAS in groundwater is a primary concern at most sites, and the migration rates are influenced by the physical-chemical properties of individual PFAS, as well as different processes that act on PFAS during transport. Depending on site-specific conditions, several nondestructive processes can contribute to decreasing PFAS concentrations with respect to distance from the source area(s) or in the source area itself over time. Understanding these processes is critical for confirming that sufficient data have been collected to identify the relevant site-specific processes, establish migration rates, assess plume stability (see Section 10.4.8), model fate and transport (see Section 10.4.9), and ultimately inform further remedial decision-making (see Section 12). Table 10-1 summarizes the types of data that could be collected and analyzed to evaluate and quantify PFAS retention, migration, and attenuation processes at a site. This table summarizes information in previous subsections and is structured similarly to the methodology included in Newell et al. (2021) as the basis for evaluating natural attenuation as part of a site remediation and management strategy. However, it should be recognized that this process is also applicable to any setting where the information would improve the CSM and remedy evaluation process for PFAS. Lastly, it is essential to understand that individual PFAS have unique properties that affect their retention and attenuation. Therefore, an evaluation of site-specific retention and attenuation processes should consider variations between individual PFAS. For example, it may be possible that PFOS may be significantly retained at a site whereas PFNA may experience less retention and/or attenuation.
Table 10-1. Methods to Assess PFAS Retention, Migration, and Attenuation (adapted from Newell et al. (2021))
| Topic | Investigative Method | Supporting Investigative Method |
|---|---|---|
| Evaluating whether sorption to solid-phase and/or air-water interface and matrix diffusion contribute to retention of PFAS |
|
|
| Evaluating transformation of precursor compounds and impact on migration |
|
|
| Quantifying influence of processes on PFAS migration/persistenc |
|
|
10.4.8 Assessing Plume Stability
At sites where PFAS has been detected in groundwater, it may be necessary to evaluate PFAS plume stability—whether the plume is stable, receding, or expanding. Plume stability and plume advancement rates are an important consideration for remedy selection. Many PFAS plumes are expected to be long-lived and possibly expanding due to the presumed lack of transformation of PFAAs and the mobility characteristics of many PFAS (especially those with shorter carbon chain lengths and anionic functional groups). Methods for evaluating plume stability include qualitative evaluations of temporal plume trends or statistical evaluations such as Mann-Kendall (ITRC 2013; ITRC 2016; AFCEC 2012; USEPA 2009).
Data uncertainties may have a greater than usual impact on plume stability evaluations for PFAS sites because of the low concentrations assessed. Monitoring records may be relatively limited, both in terms of the number of locations and the number of events that are available to evaluate. Biotransformation of precursors may also have an impact on plume stability evaluations. As such, more frequent or longer duration monitoring may be required to confirm trends or plume stability. A fate and transport model may also help provide predictions of plume behavior over time, and may be adjusted as additional site-specific data become available to aid calibration.
10.4.9 Modeling PFAS Fate and Transport
Some modeling of PFAS fate and transport has been conducted for vadose zone, groundwater, and atmospheric dispersion (McGuire et al. 2014; Barr 2017; Carey et al. 2019; Guo, Zeng, and Brusseau 2020; Persson and Andersson 2016; Gassmann, Weidemann, and Stahl 2021). Sima and Jaffe (2021) provided a critical review of applicable transport processes, modeling approaches, and potential limitations and uncertainty associated with modeling PFAS transport using existing approaches. Modeling the fate and transport of PFAS may have significant uncertainty contributed by precursor concentrations, transformation pathways and rates, and other factors. Because several of the key PFAS have not been shown to degrade naturally in the subsurface, other processes such as sorption, diffusion, and dispersion may be more important for understanding PFAS behavior upon release. However, many of these processes, such as desorption, are not well understood for PFAS (Sima and Jaffe 2021), and the accurate measurement or estimation of input parameters can be difficult. Although modeling of PFAS transport may be desirable and appropriate under certain conditions, the uncertainty of PFAS transport simulations requires that the results be qualified. Site-specific data are important for evaluating some potential model input parameters such as Koc, which can exhibit significant spatial variation. This is particularly true in source zones, vadose zones, and at or near the water table. There are situations where modeling of PFAS transport may not be appropriate due to a lack of site-specific input parameters or reliable physical chemical properties for a particular PFAS.
10.4.9.1 Vadose Zone Modeling of PFAS Fate and Transport
There may be cases where an investigator wants to conduct a general screening-level evaluation of PFAS transport in the vadose zone under different scenarios. In such cases, the use of an existing vadose zone model may provide some benefit, but only if there is a thorough understanding of the inherent limitations of the model and if the uncertainty in the results is properly communicated.
Vadose zone models such as USEPA’s VLEACH (information and model available at https://www.epa.gov/water-research/vadose-zone-leaching-vleach), and Seview’s Seasonal Soil (SESOIL) compartment model (information and model available at http://www.seview.com/aboutsesoil.htm) can simulate one-dimensional vertical transport in the vadose zone via diffusion, adsorption, volatilization, biodegradation, cation exchange, and/or hydrolysis. Most PFAS are resistant to biotic or abiotic degradation, and in general PFAS are far less volatile than many other contaminants. With the exception of the few volatile PFAS such as the FTOHs (Section 4.2.5 and Table 4-1), the most important vadose zone processes to model are the physical transport processes. However, these models do not include air-water interfacial processes that appear to be important for vadose zone migration of PFAS. Other limiting factors for these models include that they simulate flow in only one dimension (vertical), and they may not adequately capture complex nonlinear or rate-limited sorption processes for PFAS. It is also important to note that these existing models have not been validated for use with PFAS. For these reasons, these models may not be appropriate for use with PFAS at this time.
The Michigan Department of Environment, Great Lakes, and Energy (EGLE) completed a review in 2020 that evaluated several vadose zone models (MI EGLE 2020) to simulate transport of PFOA and PFOS from municipal biosolid-amended soil through the unsaturated zone to the saturated zone. Models were initially screened and nine models were selected for critical review. From the nine models reviewed, HYDRUS, an unsaturated flow and transport model (information and model available at https://www.pc-progress.com/en/Default.aspx?hydrus), was recommended as the most suitable model for vadose zone modeling of PFOA and PFOS at the time of the EGLE review. (MI EGLE 2020).
Several research groups are attempting to develop models for PFAS transport in the vadose zone that more accurately represent some or all of the relevant processes. In some cases, these efforts involve modifying HYDRUS to incorporate these processes, while other groups are developing their own vadose zone models to do the same. Several studies discussing vadose zone modeling are presented below with a simplified, possibly more efficient model discussed in Guo et al. 2022.
Guo, Zeng, and Brusseau (2020) (referenced in Section 10.4.1 above) developed what they believed to be “the first mathematical model that accounts for surfactant-induced flow and solid-phase and air-water interfacial adsorption.” They applied the model to simulate PFOS transport in the vadose zone at a model fire-training area site impacted by AFFF. The simulations were useful in developing general concepts of PFAS retention as described in Section 10.4.1. In addition, and more generally, the mathematical model provides a quantitative framework that can be extended to examine the complex interactions between dynamic flow and adsorption processes at field sites (Guo, Zeng, and Brusseau (2020)).
Zeng and Guo (2021) went on to develop a three-dimensional model for PFAS leaching in the vadose zone that allows for quantification of impacts from subsurface heterogeneities, which the authors concluded to be among the primary sources of uncertainty for predicting PFAS leaching and retention in the vadose zone.
“Due to significant computational cost and the requirement for detailed input parameters for the models,” developed by Guo, Zeng, and Brusseau (2020) and Zeng and Guo (2021), Guo et al. (2022) developed a simplified model better suited for a screening tool to quantify vadose zone PFAS leaching. The derived analytical solutions incorporate multiple transport processes (with simplifying assumptions such as linear sorption) and allow for varied initial conditions. The solutions were “then validated by application to miscible-displacement experiments under a wide range of conditions and by comparisons to a state-of-the-art comprehensive model under both experimental and field conditions applicable to PFAS-contamination sites” (Guo et al. 2022). Based on these results, the authors concluded that “the simplified analytical model provides an efficient and accurate screening-type tool for quantifying long-term PFAS leaching in the vadose zone” (Guo et al. 2022).
Silva, Simunek, and McCray (2020) modified the one-dimensional and two-dimensional versions of HYDRUS “to simulate the effects of non-linear air-water interface (AWI) adsorption, solution surface tension-induced flow, and variable solution viscosity on the unsaturated transport of PFAS in the vadose zone.” Available literature-derived unsaturated transport data for PFOA and PFOS were used to validate the revised models and provide example simulations. The study simulations showed that while AWI adsorption of PFAS can be a significant source of retention within the vadose zone, it is not always the dominant source of retention (Silva, Simunek, and McCray (2020). The contribution of solid-phase sorption can be considerable in many PFAS-contaminated vadose zones (Silva, Simunek, and McCray 2020). Further, the effects of soil textural heterogeneities on PFAS unsaturated transport are demonstrated in the example results.
A follow-up to a leaching study performed by Stahl et al. (2013) (referenced in Section 10.4.1) was completed by Gassmann, Weidemann, and Stahl (2021). The study used 8 years of data from a lysimeter and MACRO—a one-dimensional, process-oriented, dual-permeability model for water flow and reactive solute transport in soil (information and model available at https://www.slu.se/en/Collaborative-Centres-and-Projects/SLU-centre-for-pesticides-in-the-environment/models/macro-52/). The study evaluated the ability of MACRO to simulate leaching and plant uptake of PFOA and PFOS using two adsorption concepts: a kinetic two-side sorption concept usually applied for pesticide leaching (scenario I) and the formation of what Gassmann, Weidemann, and Stahl (2021) called non-extractable residues (NER) (scenario II). NER are adsorbed PFAS that either do not leach or leach very slowly from soil. Leaching of PFOA and PFOS could be adequately simulated for scenario II, but scenario I was not able to reproduce sampled leaching concentrations (Gassmann, Weidemann, and Stahl 2021). Plant uptake was simulated well in the first year after contamination but was not simulated well in the following years (Gassmann, Weidemann, and Stahl 2021). The model results suggest that more than 90% of the original mass of PFOA and PFOS is present as NER after 8 years, which the team concluded was a larger percentage of the mass compared with other studies (Gassmann, Weidemann and Stahl 2021). The authors also concluded that even though there are open questions that necessitate additional research, “the study showed that it is possible to use an existing leaching model for the long-term simulation of PFOA and PFOS leaching in unsaturated soils and the short-term simulation of plant uptake.” Furthermore, they concluded that even though not all environmental processes are yet understood, this model may already provide valuable information for groundwater protection and crop safety.
10.4.9.2 Groundwater Modeling of PFAS Fate and Transport
The development and application of modeling approaches for PFAS in groundwater is relatively limited to date, likely reflecting the complexity of PFAS fate and transport processes, the range of chemical properties, and the uncertainty regarding appropriate parameter values to use in existing models. Several processes that are expected to influence PFAS fate and transport (see Section 5) pose challenges for modeling PFAS in groundwater, including:
- Nonlinear sorption. Linear sorption implies that the distribution of a compound between its dissolved phase and any solid phases that are present (for example, soil particles) is independent of the concentration of the compound itself. PFAS sorption has been shown to be concentration-dependent, such that models that account for this behavior are better suited for applications with wide concentration ranges. However, this adds complexity because it relies on an understanding of the appropriate PFAS sorption isotherm(s) and associated parameters for the site-specific application.
- Rate-limited sorption. Solute transport models typically rely on an initial assumption of equilibrium partitioning between dissolved and sorbed phases on a compound. However, several studies have demonstrated that PFAS sorption-desorption is a rate-limited process. This requires a more detailed approach in which both the dissolved and sorbed phases are modeled to incorporate mass transfer between the phases.
- Precursor transformation. PFAS are typically released as mixtures of different compounds, a portion of which may not be identifiable using current analytical approaches. Solute transport models that rely on simplified assumptions (for example, first-order kinetics, stepwise reaction pathways) may not be able to accurately capture in situ transformation patterns. Even for PFAS transformation pathways that have been identified as potentially relevant using lab or field data, there is little understanding of in situ rates to use for modeling purposes.
Despite the challenges groundwater modeling is being attempted for some situations. Some groundwater modeling studies from the literature are discussed.
Pietrzak (2021) completed a review of available software for modeling organic pollutants in groundwater. One example, simulated transport using MODFLOW/MT3DMS (Shin et al. 2011), which summarized simulation of PFOA transport in several media, including groundwater, from a manufacturing source and linking the models. Shin et al. (2011) concluded that their models may be useful for estimating past and future concentration of PFOA in water wells in the study area. However, the effort did not include all processes that are now recognized as relevant for PFAS fate and transport.
Groundwater modeling studies published to date have focused on the impacts of specific processes and/or remediation on PFAS plume development. For example, Gefell et al. (2022) modeled hypothetical PFOA groundwater plumes using MODFLOW and MT3D based on purely hypothetical remediation and data. The study evaluated the differences between a plume resulting from a PFOA-only source compared to a source with precursors located in the overlying vadose zone. Because the plumes from both scenarios exhibited relatively similar concentrations and lengths in the absence of remediation, the authors concluded that source zone characterization is particularly important when predicting long-term plume behavior and that it may be appropriate to calibrate a model to both a terminal PFAA-only source plume and one from a precursor source. After remediation of the source and an extended postremediation flushing period, the scenario with a precursor-based source resulted in a longer plume with higher concentrations. The results for this scenario were sensitive to the precursor degradation rate, and the authors used literature values in their simulations that were derived from a combination of lab-based and field-based data.
As another consideration to improve modeling transport of PFAS in groundwater, the REMChlor-MD model (Farhat et al. 2018) has been proposed for evaluating the possible effects of matrix diffusion processes on PFAS distribution (Newell et al. 2021). This includes a study by Kulkarni et al. (2022) in which this screening-level model was used to estimate the impact of matrix diffusion on the PFOS plume extent using field data from a well-characterized AFFF site where significant PFAS mass was known to be present in lower permeability soils. The model predictions suggested that matrix diffusion contributed to a PFOS plume length at this site that was approximately 40% of the length that would have been observed in the absence of matrix diffusion. The study predicted that matrix diffusion was reducing the plume advancement rate, and that source remediation would have limited impact on the rate of future plume advancement. Another study used REMChlor-MD modeling to examine the types of sites where matrix diffusion processes would be most relevant, and the authors concluded that aquifers with embedded lower permeability layers and lenses exhibited shorter PFOS plumes than aquifers with underlying and/or overlying aquitards (Farhat et al. 2022). Long time frames were needed for plume stabilization, but these predictions were highly sensitive to dispersion parameter values since PFOS was assumed to not degrade over time. These results emphasize the site-specific nature of various PFAS fate and transport processes and highlight the importance of site-specific assessments.
In addition, selecting a representative source term for modeling may be difficult due to a lack of available data and/or limitations in the model for handling potentially complex source behavior. Ideally, groundwater transport models for PFAS should incorporate data from vadose zone models and air deposition models to provide a more holistic representation of the source term. As mentioned above, this linked approach was used in a 2011 study that examined regional transport of PFOA from a manufacturing source (Shin et al. 2011), but the model did not include all processes that are now recognized as relevant for PFAS fate and transport. In other cases, groundwater transport modeling with discharge to surface water was used to evaluate PFAS distribution within watersheds or regional scales (Raschke et al. 2022), though the level of complexity of such integrated modeling approaches may be high and could introduce additional uncertainty, particularly if the data available to calibrate the models are limited.
Another use of groundwater modeling is to evaluate groundwater surface interactions. Divine et al. 2023 provided a brief discussion of the current state of modeling PFAS and concluded that current models lack do not include complexities such as mass transfer rate limitations and precursor transformation. Additional model development and verification is needed.
10.4.9.3 Air Modeling of PFAS Fate and Transport
Modeling PFAS transport in air is receiving more attention, and USEPA has recently developed an air quality model named the Community Multiscale Air Quality model (CMAQ) for these purposes (USEPA 2022). From a personal communication with James A. Thurman, Ph.D., USEPA/OAQPS/AQAD, Air Quality Modeling Group, CMAQ can handle any kind of atmospheric reactions PFAS would undergo during transport and would also include long-range transport, more than 50 km from the source of PFAS. As more information is learned about PFAS, CMAQ can be updated to include the atmospheric reactions for PFAS. See D’Ambro (2021) for an example of the use of CMAQ to evaluate a mixture of PFAS from a fluoropolymer manufacturing facility.
Another example of atmospheric modeling of PFAS was performed by Moreno (2019). Moreno (2019) modeled transport of PFOA and HFPO-DA from two manufacturing facilities using CALPUFF, a non-steady state, long-range transport model. In addition, air quality models such as AERMOD or IISC3 Model are identified in Section 10.4.5.1. An example use of AERMOD can be found in Barr 2017. AERMOD was used to simulate the emission of PFOA from stacks at former manufacturing facilities in Bennington, Vermont, and the resulting air dispersion and deposition. The facilities applied PTFE to some fiberglass fabrics.
AERMOD is applicable in the near field, less than 50 km from the source of PFAS for qualitative assessment of local deposition from a source of PFAS when atmospheric reactions are not necessarily important (From a personal communication with James A. Thurman, Ph.D., USEPA/OAQPS/AQAD, Air Quality Modeling Group). AERMOD deposition fields could be used to analyze the spatial distribution of deposition near the source and identify areas of interest to consider for further study. More information for AERMOD can be found in USEPA (1995); Wesley, Doskey, and Shannon (2002); and USEPA (2003).
USEPA provides a Support Center for Regulatory Atmospheric Modeling (SCRAM) website at https://www.epa.gov/scram (accessed August 10, 2023) that includes links to air quality models and tools.
10.4.9.4 Visualization Methods
One of the challenges associated with characterization of PFAS sites is the analysis of trends for a number of PFAS constituents that may be sampled in soil and groundwater, and then the communication of the results of these analyses to a less technical audience. Typical site characterization visualization methods such as plume maps, cross-sections, fence diagrams, 3D models may be used to depict the horizontal and vertical extent of PFAS plumes. Several other visualization methods may be helpful when analyzing PFAS data, including:
- bar charts that show the relative concentrations of individual PFAS constituents at each location to help evaluate PFAS composition trends in soil and groundwater (for example, figures 6 and 7 of 7 Field (2017), Figure 15-1)
- radial diagrams to illustrate:
- transformations of precursors to PFCAs and/or PFSAs along a flow path (for example, see Section 15.1.1)
- relative concentrations of constituents at each sample location to assist with source fingerprinting and to identify potential risk drivers in different parts of a plume
- locations of potential hot spots
- general extent of a PFAS plume.
Case study examples of these different methods are discussed in Section 15.1.
10.5 Forensics and Source Identification
The Priority Topics for Fate and Transport, Surface Water, Source ID, and Site Characterization include information source identification, differentiation, and forensics (see Section 1.3.7).
The field of environmental forensics is a formal technical discipline that spans chemistry, environmental science, and engineering (for example, Morrison 2000; Morrison and Murphy 2006; Mudge 2008; Murphy and Morrison 2015; Sullivan et al. 2001; Wang and Stout 2007). Environmental forensics is used to address problems such as source identification, timing of releases, and contaminant fate and transport. As compared to legacy contaminants such as PAHs and PCBs, the application of forensics to PFAS forensics is in its nascent stages. Researchers are still conducting studies to more fully understand the fate and transport of PFAS in the environment, and they continue to evaluate tools to investigate changes in PFAS composition for the purposes of source attribution. Multivariate methods have been applied to investigate sources of PFAS, including human exposure in the Faroe Islands (Hu et al. 2018), contributions to surface water in the northeast United States (Zhang et al. 2016), and contributions to surface water and sediment in South China (Pan et al. 2014). Benotti et al. (2020) and Charbonnet et al. (2021) both advocated the use of a variety of tools that are applied in a tiered approach for characterizing the PFAS signatures associated with source materials and environmental contamination. It has been observed that the PFAS sources profiles associated with different PFAS uses are frequently highly variable. Until a more complete understanding of the chemical composition of source materials is available, and until researchers understand the full scope of forensic information that may help elucidate sources, source libraries associated with different usage profiles are incomplete at best. Given these uncertainties, the best approach for associating or dissociating environmental contamination from one or more sources is to compare PFAS information in environmental samples to similar information from site-specific source areas. An overview of PFAS source identification analyses can be found in Dorrance, Kellogg, and Love (2017).
To that end, any site-specific investigation begins with a careful review of available records. In a best-case scenario, such records may directly link a source to environmental contamination without significant contribution from any other potential sources. More often than not, source attribution of PFAS contamination is more complicated. Groundwater plumes of PFAS contamination can be heterogeneous due to weathering and differential rates of subsurface transport between PFAS. Care must be taken not to attribute changes associated with fate and transport to different sources. Recent experience shows that multiple groundwater plumes with a similar or disparate profiles are commonly observed to intersect and commingle. If there are two or more likely sources contributing to mixed contaminant plumes, defining the footprint associated with these different sources can be challenging. In addition, atmospheric transport and deposition of PFAS can be important and result in PFAS sources with regional impacts (Ahrens et al. 2016; Davis et al. 2007; Galloway et al. 2020).
When identifying PFAS sources, some important factors to consider include:
- data quality, where care must be taken to ensure that analytical results from different time periods, different methods, or different labs are comparable, as older data sets may provide incomplete information when compared to more recent data
- target PFAS list, where a reduced compound list may prevent full differentiation between sources. Linear versus branched (isomer) distinction may also be important in differentiating sources
- matrix effects, care must be taken to account for differences in PFAS profiles associated with different matrices. For example, soil PFAS profiles can be significantly altered during leaching to groundwater
- temporal effect, where an understanding of historical production, use, and release of PFAS becomes important, as is an understanding of differences between samples due to weathering processes that may be interpreted as different sources
- spatial effect of long-distance air deposition and regional sources versus local sources
- sample collection procedures to ensure there is no cross-contamination from other sources during sampling
- rigorous exploration of potential sources to ensure that all sources of potential interest have been identified and considered
- weight of evidence based on multiple lines of inquiry
The following sections describe some of the source identification tools that may be used or considered for use in identifying sources of PFAS.
10.5.1 Source Identification Tools
Chemical fingerprinting often involves the evaluation of the relative proportions of different substances in a mixture to link contaminants in the environment to one or more known or suspected sources (see the text box in Section 10.4.5.2). The data from available analytical methods can be evaluated using various graphical, statistical, and geospatial techniques. These methods have been commonly used for legacy contaminants such as petroleum and chlorinated compound source identification and can potentially be applied to PFAS mixtures. The following sections describe some of the forensic information that may be useful to evaluate sources, as well as some tools for comparing samples within a data set.
10.5.1.1 Manufacturing Signatures
PFAAs (PFCAs and PFSAs) can be produced as a mixture of homologues of different chain lengths depending on the various manufacturing process(es) used (Section 2.2). PFAAs produced by electrochemical fluorination (ECF) can include both even and odd chain-length homologues. PFAAs produced by fluorotelomerization contain mostly even chain-length homologues. However, transformation of some of the fluorotelomer precursors results in the formation of odd chain length PFCAs (Prevedouros et al. 2006; Dasu, Liu, and Lee 2012; Liu and Mejia Avendano 2013). Most commercial laboratories can report PFCA homologues ranging from C4 to C14 and select PFSA homologues between C4 and C12. USEPA (2009) published PFCA profiles in various commercial products that showed different patterns of PFCA chain lengths. So, while chemical fingerprinting for source identification may be useful for PFAS sites, changes in raw materials and processes over time, as well as environmental fractionation, must be taken into account.
Laboratories generally report the concentration of a given PFAA as the total of the branched and linear forms; however, the concentration of the linear form and an estimated concentration for the branched form can often be reported independently. The concentration of branched forms typically must be estimated because standards do not yet exist for most branched-chain PFAA (Section 11.2.1). Benskin (2011) used the absence of branched PFCA isomers in dated sediment cores of two lakes to support the conclusion that oxidation of FTOH was the major atmospheric source of PFCAs in the lakes and not direct transport of PFOA. Fredriksson (2016) used isomer profiles along with homologue patterns to assess the sources of PFAS in avian eggs. However, the potential for environmental fractionation must be taken into account when evaluating isomer profiles because linear and branched-chain isomers have different physical and biological properties, adsorption, and bioaccumulation (Fredriksson 2016; Miralles-Marco and Harrad 2015). Other examples of isomer analysis for PFAS source identification include Shi et al. (2015), Benskin, DeSilva, and Martin (2010), and Karrman et al. (2011).
Chiral fingerprinting through enantiospecific isomer differentiation is a potential method for source identification, although its use is still under development. Asher et al. (2012) applied this method to identify PFAS sources to an aquatic foodweb. However, they noted several limitations and assumptions when using this method for PFAS source identification.
10.5.1.2 High-Resolution Mass Spectrometry (HRMS)
High-resolution mass spectroscopic methods using quadrupole time-of-flight mass spectrometry (qTOF/MS) can be used to determine both the chemical formula and structure of unknown PFAS in source materials (see Section 11.2.2.5 for further information on qTOF/MS) (Newton et al. 2017; Moschet et al. 2017; Barzen-Hanson et al. 2017; Battelle 2020; Washington et al. 2020; Getzinger, Higgins, and Ferguson 2021; Guelfo et al. 2021). PFAS suspect screening libraries have been developed to include broader lists of PFAS analytes found across many different PFAS sources (Newton et al. 2017; Moschet et al. 2017; Barzen-Hanson et al. 2017; Getzinger, Higgins, and Ferguson 2021). Because analytical standards are not available for most PFAS included under this extended list of analytes, often these analytical tools are used for qualitative/semiqualitative analysis. These methods have the potential to greatly increase the number of identified PFAS, including precursors and the transformation products, and hence provide more accurate source identification (Washington et al. 2020, Getzinger, Higgins, and Ferguson et al. 2021; Guelfo et al. 2021). The addition of a broader list of analytes increases the power to resolve differences in PFAS profiles and therefore characterize sources and source footprints.
10.5.1.3 Visual Representations of Data
It is common to show representations of measured PFAS in figures or graphs to give the reader a visual sense for relative abundance. Two common graphs for representing PFAS data are bar graphs and radar plots. If one is considering the role of concentration, then it may be helpful to plot PFAS concentrations on the axes. However, if one is considering the patterns of data, then it is helpful to plot relative abundance, or the concentration of each PFAS divided by the sum of all measured PFAS, on the axes. It is also suggested to group subclasses of PFAS together and order them by perfluorinated alkyl chain length. For example, PFCAs ordered from the shortest to longest perfluorinated alkyl chain length, followed by PFSAs ordered from the shortest to longest perfluorinated alkyl chain length, followed by fluorotelomer sulfonates ordered from the shortest to longest perfluorinated alkyl chain length allows the viewer to compare changes in compositional patterns both within and between different subclasses of PFAS to assess changes that may occur due to environmental fate and transport. When showing data in this fashion, it is common to report estimated concentrations or J-flagged values and use the value of zero (0) for nondetects. However, other methods for assessing nondetects could be considered (Johnson et al. 2015). A comparison of PFAS signatures between two samples (Sample A and Sample B) using either bar graphs (Figure 10-2) or radar plots (Figure 10-3) is shown below.
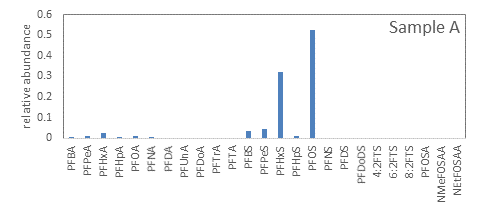
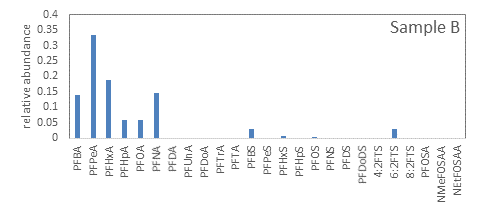
Figure 10-2. Comparison of PFAS signatures in Sample A and B using bar graphs. The concentration of each PFAS has been divided by the sum of all measured PFAS to represent the relative abundance of PFAS in each sample.
Source: M. Benotti, NewFields. Used with permission.
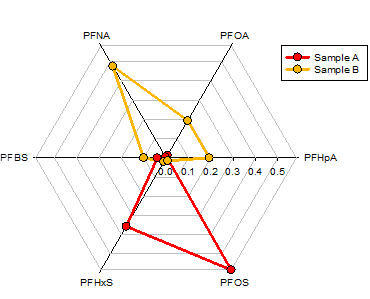
Figure 10-3. Comparison of PFAS signatures in Sample A and B using radar plots. The concentration of each PFAS has been divided by the sum of all measured PFAS to represent the relative abundance of PFAS in each sample.
Source: M. Benotti, NewFields. Used with permission.
10.5.1.4 Diagnostic Ratios
In some applications of PFAS forensics, it may be beneficial to show similarities or differences between sample signatures using relative abundances of one or more PFAS or diagnostic ratios, or double ratio plots. Without a comprehensive library of PFAS source materials, such ratios should be site-specific, and should be selected to query the data for a site-specific question and to show similarity or differences between contamination throughout the site and those in known or purported source area/s. Examples of factors that may help identify suitable diagnostic ratios include the relative abundance of PFCAs, PFSAs, or FTSs, the ratio of PFCAs to PFSAs (or more specifically the ratio of PFOA to PFOS), the ratio of even-numbered to odd-numbered PFCAs, the relative abundance of linear to branched isomers of selected PFAS, and others. Table 10-2 shows some example diagnostic ratios for PFAS in Sample A and Sample B above.
Table 10-2. Example diagnostic ratios to compare PFAS signatures of Sample A and Sample B.
| Sample A | Sample B | |
|---|---|---|
| relative abundance of PFCAs | 0.062 | 0.93 |
| relative abundance of PFSAs | 0.94 | 0.041 |
| relative abundance of FTSs | 0 | 0.029 |
| PFCAs/PFSAs | 0.066 | 22 |
| PFOA/PFOS | 0.0217 | 13 |
10.5.1.5 Multivariate Statistical Tools
The statistical methods used in fingerprinting chemical mixtures range from simple visual comparisons of the relative chemical composition in environmental samples to more sophisticated multivariate statistical analyses of large environmental data sets (Bock et al. 2021; Cejas and Barrick 2021; Wenning and Erickson 1994; Johnson et al. 2006; Otto 2016; Brereton 2009). Multivariate statistical tools are ideally suited to the analysis of chemical mixtures. These tools have been applied to chemical mixtures such as PCBs, hydrocarbons, and dioxins for many decades. PFAS data sets, including TOP assay data, are similarly amenable to a variety of multivariate numerical data analysis techniques that provide a means to categorize PFAS compositional data. The advantages of multivariate numerical methods are that they provide a convenient means to analyze large data sets and reduce the output into relatively straightforward graphical output that describes the most important factors affecting chemical variability throughout the data set. Principal component analysis (PCA) is a multivariate statistical procedure that uses an orthogonal transformation to convert a set of observations of possibly correlated variables into a set of values of linearly uncorrelated variables called principal components. In other words, it identifies and graphically shows the most important features of data that describe similarities and differences between sample chemistries within a data set. The investigator can use this tool to identify samples that have similar or different PFAS signatures and what changes are driving those differences. Changes in PFAS patterns may be attributable to changes associated with fate and transport, or there may be changes that can be explained only by additional sources. Figure 10-4 presents an example PCA scores plot, which demonstrates the similarity or dissimilarly of PFAS signatures between all samples in a data set. PCA is most effective when supplemented with other lines of evidence such as cluster analysis, ratios, and geospatial methods.
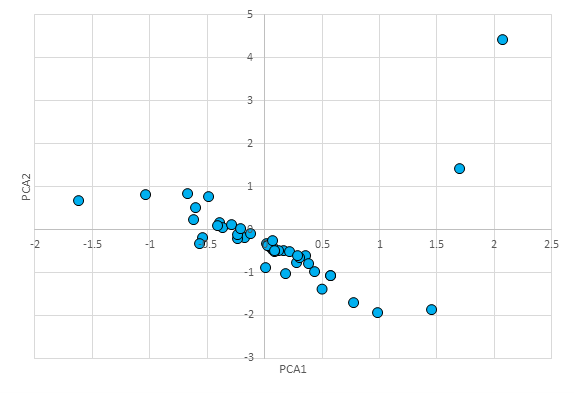
Figure 10-4. PCA scores plot of the analysis of a PFAS data set. Each circle represents the pattern of PFAS contamination of an individual sample. Samples that plot close together have similar PFAS signatures. Samples that plot apart have dissimilar PFAS signatures.
Source: M. Benotti, NewFields. Used with permission.
Examples of chemical fingerprinting for PFAS source identification can be found for wastewater treatment plants (Clara et al. 2008), differentiating AFFF sources (KEMI 2015; Hatton, Holton, and DiGuiseppi 2018; see also Section 3.5), landfills (Lang et al. 2017; Xiao et al. 2012), surface water (Xie et al. 2013), sediment (Qi et al. 2016), and groundwater (Yao et al. 2014). Multivariate statistical analyses (that is, PCA, cluster analysis, and unmixing models) and geospatial analysis have been used extensively to distinguish PFAS sources. Guelfo (2017) emphasized the importance of geospatial distribution of PFAS for source identification. Qi et al. (2016) used PCA–multiple linear regression, positive matrix factorization, and unmix models to identify four PFAS sources (textile treatment, fluoropolymer processing aid/fluororesin coating, textile treatment/metal plating, and precious metals). Zhang et al. (2016) used PCA, hierarchical clustering, and geospatial analysis to determine sources in the northeast United States, and Lu et al. (2017)[652] used factor analysis to classify three categories of PFAS in impacted groundwater. Pan et al. (2014) used PCA in water and sediment samples to distinguish between rural/agricultural and urban/industrial sources.
Other methods that have been applied to other chemical mixtures, such as statistical unmixing and big data/machine learning methods, also hold promise for the analysis of PFAS mixtures. As with any complex data analysis method, these methods have strengths and weaknesses that must be understood by the user. Thus, PFAS forensics practitioners must keep current on new developments in chemical forensics and statistical analysis. Given differences in the environmental fate and transport of different types of chemical mixtures and the complex behavior of PFAS, the forensics scientist must carefully evaluate any data analysis method to ensure it is being applied and interpreted appropriately. Because of the many complexities associated with PFAS production, historical usage, and fate and transport processes, the risk of incorrect conclusions can be especially high. We advocate for a weight of evidence approach based on (1) historical information regarding usage and other information, (2) a detailed consideration of transport pathways such as air emissions, spills, and wastewater discharge, (3) an analysis of transport processes such as local groundwater transport, the presence of groundwater divides and other barriers, and air speed and direction, (4) concentration gradients, (5) the analysis of diagnostic ratios, (6) multivariate statistical methods, (7) a consideration of branched versus linear isomers, and (8) other information that can be used to understand sources, discharges, and fate and transport.
SERDP PFAS Novel Methods for PFAS Source Tracking and Allocations
ER20–1375 Comprehensive Forensic Approach for Source Allocation of Poly- and Perfluoroalkyl Substances – Chris Higgins, Colorado School of Mines
ER20–1121 Establishing an Approach to PFAS Forensics and a PFAS Source Materials Forensic Library – Mark Benotti, NewFields Government Services
ER20–1205 Machine Learning Pattern Recognition for Forensic Analysis of Detected Per- and Polyfluoroalkyl Substances in Environmental Samples – Tohren Kibbey, University of Oklahoma
ER20–1265 Ultrahigh-Resolution Fourier-Transform Ion Cyclotron Resonance Mass Spectrometry for Fingerprinting, Source Tracking, and Allocation of Per- and Polyfluoroalkyl Substances (PFAS) – Jens Blotevogel, Colorado State University
ER20–1056 Improving Access and Utility of Analytical Data for the Confident Discovery, Identification, and Source-Attribution of PFAS in Environmental Matrices – Benjamin Place, NIST, Department of Commerce
–
Updated January 2026.

