5 Environmental Fate and Transport Processes
This section provides current information about PFAS fate and transport in the environment. Understanding relevant fate and transport processes for PFAS is critical in evaluating the potential risk from a release, where to look for PFAS following a release, and what treatment alternatives may be effective. The available information about fate and transport processes varies between the different PFAS. PFAS fate and transport is a rapidly evolving field of science.
5.1 Fate and Transport Introduction
5.1.1 Overview of PFAS Fate and Transport
PFAS fate and transport describes the behavior of these compounds following their release to the environment. This includes the physical, chemical, and biological processes that influence distribution of PFAS in various media, as well as the extent of migration within and between media (for example, plume development, groundwater discharge to surface water). Given the wide variety of PFAS, it is not surprising that they collectively exhibit a wide range of different physical and chemical characteristics that can affect their behavior in the environment. This adds to the complexity of fate and transport assessments and highlights the risk in making broad assumptions based on the behavior of a few well-studied PFAS.
Understanding relevant fate and transport processes for PFAS is critical in answering several key questions:
- What are the transport mechanisms for PFAS in the environment? PFAS fate and transport characteristics can assist understanding of the mechanisms through which PFAS discharge and migration may occur (for example, atmospheric/vapor transport, surface water runoff, infiltration into the subsurface, vadose zone sorption/leaching, groundwater migration).
- What is the potential risk from a PFAS release? An understanding of fate and transport processes provides the basis for defensible predictions about occurrence, migration, persistence, and potential for exposure.
- Where do I need to look for PFAS following a release? Knowledge of PFAS fate and transport characteristics strongly informs site characterization by providing insight on where efforts should be focused and developing an appropriate conceptual site model (CSM).
- How can I treat PFAS? Establishing how these compounds behave in the environment is important in developing and/or selecting PFAS treatment strategies.
5.1.2 Factors Affecting PFAS Fate and Transport
Factors that influence PFAS fate and transport can be broadly divided into two categories:
- PFAS characteristics: Critical factors include the chain length, the ionic state of the compound (for example, the charge(s) carried by the molecule at a typical environmental pH), the type of functional group(s), and the extent of fluorination (for example, perfluorinated versus polyfluorinated compounds). These properties strongly influence the type and extent of PFAS partitioning and transformation that can be expected to occur. A description of these physical-chemical properties is provided in Section 4.
- Site characteristics: Site characteristics generally define the nature of the source but also have an effect on PFAS-media interactions. Potentially relevant characteristics include soil type (including properties such as permeability, surface charge, organic carbon content, exchange capacity, mineralogy, water content), depth to groundwater, aquifer characteristics (for example, geology, presence of confining layers), oxidation-reduction conditions, precipitation/infiltration rates, groundwater velocities/flow directions, groundwater/surface water interactions, surface water flow rates, prevailing atmospheric conditions, and the presence of co-contaminants.
The characteristics of sites with releases of PFAS often share many similarities with sites having releases of other contaminants, although there are some source scenarios that are relatively unique to PFAS (see Section 2.6 for description of source scenarios). In addition, relevant transport pathways for PFAS can be similar to those for other contaminants. For example, transport of PFAS in groundwater as the result of advection is a potential concern at many sites where PFAS-containing products have been released. Although many PFAS share similar characteristics, such as resistance to transformation, those same PFAS may have widely varying physical-chemical properties, such as those associated with partitioning. As a result, PFAS fate and transport in the environment can be quite different from other contaminants. Therefore, this section focuses on mechanisms where PFAS behavior is different from other contaminants.
5.1.3 Section Organization
This section includes a detailed description of several processes that are particularly relevant for PFAS fate and transport and are illustrated in Figure 5-1.
- Partitioning: Both hydrophobic partitioning to organic carbon and electrostatic interactions between charged surfaces and PFAS are discussed, along with the tendency of PFAS to aggregate at air-water interfaces. These processes can affect migration in the environment by promoting retention within sediments and unsaturated soils, as well as retardation within groundwater. Varying degrees of retention on solids can contribute to differential transport where certain PFAS (for example, short-chain, anionic) are more rapidly transported than others.
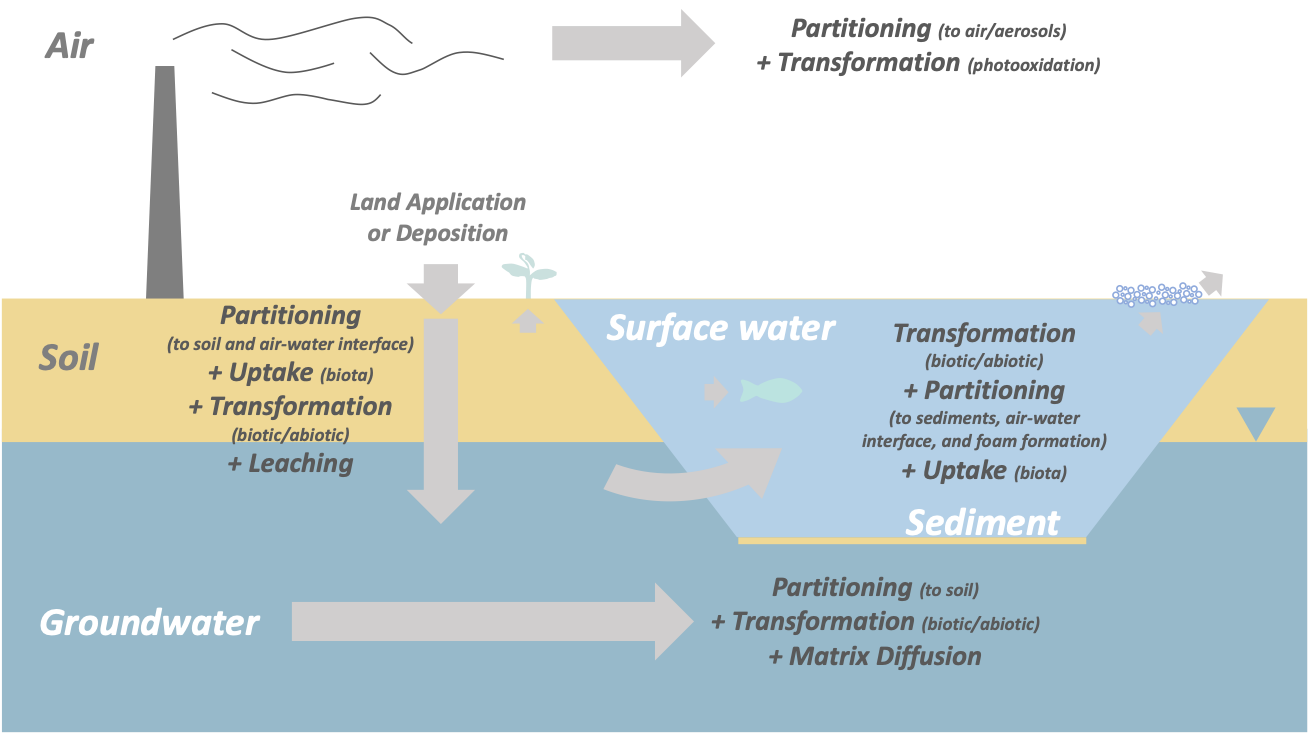
Figure 5-1. Fate and transport processes relevant for PFAS.
Source: D. Adamson, GSI. Used with permission.
- Media-specific processes: The potential impact of processes such as diffusion into low-permeability matrices, atmospheric transport, and leaching from soil to groundwater are described. Unlike the broader processes of partitioning and transformation, most of these processes are unique to specific media or a specific cross-media transport pathway.
- Transformation: Although a number of individual PFAS, such as perfluoroalkyl acids and perfluoroalkyl ether carboxylic acids, are highly persistent due to the strength of the C-F bond, a number of polyfluorinated substances can be partially degraded via several different biological and abiotic mechanisms. Transformation of these precursors to PFAAs has been shown to occur in a variety of environmental media and can result in unexpected temporal and spatial trends in PFAS occurrence. The susceptibility of individual PFAS to transformation processes can also influence how each will bioconcentrate and bioaccumulate within various biotic species.
- Uptake into biota and plants: Once released into the environment, PFAS will migrate to both terrestrial and aquatic systems. Uptake into plants can occur within affected areas and may transfer PFAS to wildlife and humans that consume those plants. Some compounds have a propensity to bioaccumulate and then biomagnify up the food chain, with relatively low levels in invertebrates and fish and higher levels observed in animals at the top of the food chain (for example, seals, seabirds, polar bears).
As noted previously, the physical-chemical properties of PFAS, and the influence of these properties on PFAS fate and transport within environmental media, are critical in determining how these compounds behave after they are released. To date, our understanding of PFAS fate and transport has relied largely on assumptions based on these physical-chemical characteristics, even though the specific parameter values have proven challenging to estimate; however, there is an increasing amount of lab- and field-derived data that has improved the empirical basis for understanding PFAS fate and transport. This section focuses on findings from peer-reviewed studies that directly evaluated PFAS fate and transport and provided key insight on the processes described above. The material in this section is also intended to provide a technical basis for subsequent sections on site characterization (Section 10) and treatment of PFAS (Section 12).
5.2 Phase Partitioning
5.2.1 Introduction
PFAS most commonly detected in the environment typically have a carbon-fluorine tail and a nonfluorinated head consisting of a polar functional group (see Section 2.2 for more information about naming conventions and terminology). The tail is hydrophobic and generally lipophobic (attracted neither to water nor to nonpolar organic matter), while the head groups can be polar and hydrophilic (attracted to water) (Buck et al. 2011). The competing tendencies of the head and the tail can lead to a widespread yet uneven distribution in the environment. Given the heterogeneity of subsurface environments, soils with different surface charges, organic carbon, interfaces between air and water, and interfaces with water and hydrocarbon co-contaminants, multiple partitioning mechanisms should be considered when characterizing PFAS fate and transport. PFAS may also exhibit different behavior depending on concentration, such as the tendency to form micelles at high concentrations (Section 5.2.2.2). Although the structure of PFAS makes them generally oil- and water-resistant in many products (for example, dry surface coatings), in the aqueous phase, PFAS may not exhibit lipophobic tendencies, as shown by the ability of a variety of PFAS to partition to phospholipid bilayers (bacterial membranes) (Jing, Rodgers, and Amemiya 2009; Fitzgerald et al. 2018).
Important PFAS partitioning mechanisms include hydrophobic effects, electrostatic interactions, and interfacial behaviors. Electrostatic effects are a function of the charge of the polar functional group at the head of the molecule and are one of the processes that generally drive the association with organic carbon in soils. For instance, natural soils and aquifer materials often have a net negative surface charge that can repel the negatively charged heads of PFAAs, which are usually present as anions in environmental media, while attracting cationic or zwitterionic PFAS. As is the case for all surfactants, the competing nature of the head and tail groups result in accumulation along interfaces of environmental media such as soil/water, water/air, and water/nonaqueous phase liquid (NAPL) co-contaminants (Guelfo and Higgins 2013; McKenzie et al. 2016; Brusseau 2018).
5.2.2 Considerations for PFAS Partitioning
5.2.2.1 Pure Phase PFAS
Due to high aqueous solubility, PFAS occurrence as a separate phase in the environment (for example, solid PFAS, LNAPL PFAS, or DNAPL PFAS) is uncommon. Although PFAS may exist as solid salts, typical product applications involve miscible solutions that are frequently mixtures of many different compounds. Several of these compounds exhibit relatively high solubility in water (the Physical and Chemical Properties Table, Table 4-1 provided as a separate Excel file), defined by Ney (1995) as exceeding 1,000 mg/L water. For example, PFOA has a reported solubility of 9,500 mg/L at 25°C (USEPA 2017). Note that PFAS interactions with NAPL co-contaminants within the subsurface have been reported and can impact migration in the subsurface (Section 5.2.5).
5.2.2.2 PFAS Micelles and Foam Formation
A surfactant is a substance that tends to lower the surface tension of a liquid into which it is dissolved. As discussed in Section 4.2.7, the surfactant properties of some PFAS may result in the assembly of PFAS molecules into supramolecular aggregations (micelles, mixed micelles, hemi-micelles, or bilayer structures; see Figure 5-2). The surfactant properties of PFAS are also what cause collection at interfaces like the air-water interface (see Section 4.2.8 and Figure 4-1). The surfactant properties, along with heat resistance, have been exploited for applications such as AFFF, which forms a thin film of water over the fuel source.
With respect to supramolecular aggregations, there is experimental evidence that PFAS can act like ionic hydrocarbon surfactants and form micelles at a critical micelle concentration (CMC) (Pedone et al. 1997; Downer et al. 1999), and many have theorized that, also like ionic hydrocarbon surfactants, hemi-micelle formation may begin at concentrations as low as 0.001 times the CMC (Johnson et al. 2007, Yu et al. 2009). The majority of these data are focused on PFAAs, but GenX has also recently been shown to form micelles (Kancharla et al. 2022). CMCs for various PFAS are discussed in Section 4.2.7. More research is needed on the tendency for PFAS to form traditional micelles (oil-in-water emulsions), since there is some data that suggest PFAS supramolecular aggregation may not be directly analogous to ionic hydrocarbon surfactant behavior (Costanza et al. 2019 and discussed in Section 4.2.7). Additionally, the interrelated functions of several environmental variables (presence of co-contaminants, ionic concentration, pH, etc.) present additional complexities that research has only begun to address.
Because the known CMCs of PFAAs are much greater than typical environmental concentrations (with the exception of possible AFFF source releases), some researchers have concluded that the behavior of PFAAs at the CMC likely has little practical relevance (Horst et al. 2018; Brusseau et al. 2018). However, like ionic hydrocarbon surfactants, hemi-micelle formation of PFAAs may begin at concentrations as low as 0.001 times the CMC (Johnson et al. 2007; Yu et al. 2009), which is potentially relevant to the understanding of PFAA sorption for both the creation of potential treatment technologies and environmental fate and transport. The interaction of supramolecular aggregations of PFAAs with both charged and hydrophobic surfaces can affect the magnitude of sorption, but the extent and even the direction of influence is dependent on many factors (Deng et al., 2012; Zhang, Zhang and Liang, 2019; Du et al. 2014). For example, adsorption of the hydrophilic portions of PFAAs (that is, the “heads”) onto positively charged absorbent surfaces can contribute to the formation and accumulation of hemi-micelles on surfaces. Simultaneously, it is possible that hemi-micelles and even micelles can block the intraparticle pores of porous surfaces, reducing the magnitude of sorption.
In surface water, PFAS may accumulate within the surface micro layer (SML) that is defined as the thin layer (50 μm) of water in contact with the ambient air (Section 16.5.5). This accumulation can also lead to foam formation above the surface water due to winds, waves, or other turbulent forces that introduce air into the water. In these cases, the presence of natural dissolved organic carbon within the water body can also enhance foam formation and contribute to enrichment of PFAS in these foams even at PFAS concentrations that are below reported CMCs (Schwichtenberg et al. 2020). This foam is different from AFFF because it is likely caused by the aggregation of dissolved-phase PFAS followed by agitation within a surface water body. As discussed in the Surface Water Foam Section (Section 16.5), the formation of this type of PFAS-containing foam above the surface of the water has been sampled and analyzed near or downgradient of areas where PFAS have been released (MI EGLE 2021).
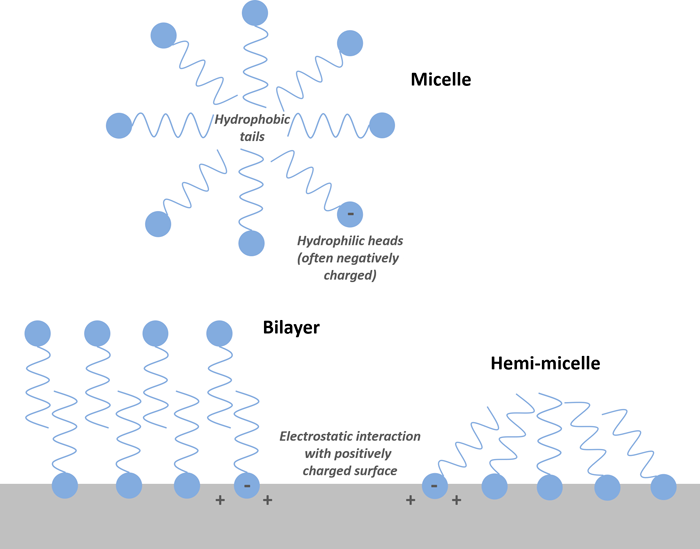
Figure 5-2. Illustration of the formation of PFAS micelles, hemi-micelles, and bilayers. Also shown is an example of aggregation at a positively charged surface. Note that the opposite effect (electrostatic repulsion of PFAS) can occur if the surface is negatively charged.
Source: D. Adamson, GSI. Used with permission.
5.2.3 Partitioning to Solid Phases
PFAS can partition to a number of different solid-phase materials, including soils and sediments (Higgins and Luthy 2006), biosolids (Venkatesan and Halden 2013), sewage solids (Ebrahimi et al. 2021), iron oxides in acidic environments (Campos-Pereira et al. 2020), and organic matter (Fitzgerald et al. 2018). Partitioning to solids results in retention of PFAS on the solids, thereby reducing or retarding leaching from vadose zone sources and retarding PFAS migration in the saturated zone. Conversely, PFAS may also partition to mobile colloids, resulting in facilitated transport rather than retardation (Brusseau et al. 2019), which may be particularly important in environments where colloidal transport is more likely to occur, such as sediment transport and deposition in moving water and environments undergoing wet-dry or freeze-thaw cycles (Borthakur et al. 2021). Section 5.3.4.2 discusses surface water/sediment interactions.
In addition, published studies of migration of PFAS in bedrock aquifers are scarce, but many of the processes controlling sorption in soils will be limited in fractured crystalline bedrock aquifers, resulting in potential for migration of PFAS over longer distances once plumes migrate to the bedrock aquifer.
5.2.3.1 Partitioning Processes
As discussed in Section 5.2.1, partitioning of PFAS to solids and soils is widely studied and is thought to occur through two primary processes: 1) sorption through electrostatic interactions, and 2) sorption to organic matter via hydrophobic interactions (Higgins and Luthy 2006) (see Sections 5.2.1 and 5.2.2 for a discussion of interfacial behavior, another subset of partitioning). The relative contribution of each process can vary depending on the PFAS, soil composition, surface chemistry, ion concentration, and other geochemical factors. Because the multitude of PFAS span a broad range of compositions and carbon chain lengths, PFAS partitioning to solids can be variable and uncertain, and dependent on site-specific factors.
5.2.3.2 Electrostatic Interactions
The contribution of electrostatic interactions to partitioning is highly dependent on soil type and soil chemistry (particularly pH and the presence of polyvalent cations). Most soils contain both fixed-charge and variably charged surfaces, such that the net charge on the soil, as well as the charge of functional groups of individual PFAS, can be strongly influenced by pH. For example, the net negative charge on most clay minerals can result in electrostatic interactions with cationic functional groups that are present on some PFAS (Barzen-Hanson et al. 2017).
Changes in pH potentially impact these electrostatic processes by altering surface charges, or possibly the ionic nature of the PFAS (Nguyen et al. 2020). Lower pH values and higher calcium concentrations in soil solutions have been associated with increased sorption of anionic PFAS such as PFOS and other PFAAs (Higgins and Luthy 2006), although the buffering capacity of some soils (for example, carbonate minerals) may mitigate fluctuations in pH. Furthermore, increased concentrations of some polyvalent cations, such as Ca2+, Mg2+ Fe2+, which sorb strongly to permanent charge sites on clay minerals, can lead to increased partitioning to soil for some PFAS (Higgins and Luthy 2006; McKenzie et al. 2015), although the effect on cationic and zwitterionic PFAS can vary widely, which has been attributed to charge differences in the PFAS functional groups (Mejia-Avendaño et al. 2020). Although the literature has attributed anionic PFC sorption to iron-oxide materials, the dominant parameter influencing sorption in the Higgins and Luthy (2006) study was organic matter content.
5.2.3.3 Sorption to Organic Matter
In Higgins and Luthy (2006), where organic carbon ranged from 0.56% to 9.66%, and other studies, organic carbon was found to be the dominant parameter driving the extent and kinetics of PFAS sorption (Higgins and Luthy 2006; Li et al. 2018; Li et al. 2019; Sima and Jaffe 2021; Wei et al. 2017). PFCAs and PFSAs tend to associate with the organic carbon fraction of soil or sediment (Higgins and Luthy 2006; Guelfo and Higgins 2013) in the saturated and unsaturated zones, although as anions at environmental pH values (see Section 4.3.2 ), they are relatively mobile in groundwater (Xiao et al. 2015).
Sorption to organic carbon generally increases with increasing perfluoroalkyl tail length, which is also associated with increased hydrophobicity (Higgins and Luthy 2006; Guelfo and Higgins 2013; Sepulvado et al. 2011; Campos Pereira et al. 2018; Cai et al. 2022), indicating that the short-chain PFSAs (for example, PFBS) and PFCAs (for example, PFBA) are less retarded than their long-chain counterparts (PFOS and PFOA, respectively). In addition, PFSAs tend to sorb more strongly than PFCAs of equal chain length (Higgins and Luthy 2006), and linear isomers are more sorptive than branched isomers (Karrman et al. 2011). Although simple correlations with organic carbon appear to be insufficient to predict PFAS partitioning coefficients, it is important to evaluate what PFAS are present and to quantify the fraction of organic carbon (foc) to model PFAS sorption as a potential predictive tool for estimating PFAS retention and retardation for certain PFAS.
5.2.3.4 Partitioning Coefficients
Table 4-1, provided as a separate Excel file, presents the range of available organic carbon partitioning coefficients (Koc) for PFAS commonly observed in the environment. Koc is a soil organic carbon-normalized adsorption coefficient and may serve as a useful parameter for evaluating potential retardation. However, this parameter does not directly capture any contributions from electrostatic interactions (Higgins and Luthy 2006), meaning that, depending on the PFAS being evaluated, estimating sorption by measuring the foc in soil in combination with a literature-derived Koc value may underestimate (or in some cases, overestimate and the associated error could be significant) retardation. Additional site-specific information such as pH, presence of polyvalent cations, and electrostatic processes retardation coefficients, are mentioned in Section 10.4.2.
Li, Oliver, and Kookana (2018) compiled data from several literature studies and concluded that the bulk partitioning coefficients (Kd) estimated for various PFAS were best correlated with organic carbon content and pH. However, a study by Barzen-Hanson et al. (2017) showed a general lack of correlation between soil parameters (such as organic carbon) and partition coefficients derived for some PFAS, such as anionic fluorotelomer sulfonates as well as several cationic and zwitterionic PFAS. Anderson, Adamson, and Stroo (2019) reviewed field data from a large number of AFFF release sites and deduced that organic carbon significantly influences PFAS soil-to-groundwater concentration ratios, and they used statistical modeling to derive apparent Koc values for 18 different PFAS based on these data.
The use of partitioning coefficients to estimate sorption requires the assumption of steady state conditions, which rarely occur in natural systems. In idealized systems, PFAS sorption kinetics vary by functional group and carbon chain length, as well as soil composition, but equilibrium is generally achieved over several days to weeks (Xiao et al. 2017; Schaefer et al 2021). Lab-based and modeling studies have established that partitioning of PFAS cannot be easily modeled using equilibrium sorption parameters in some cases due to rate-limited sorption considerations (Guelfo et al. 2020;Brusseau 2020). Lab-based Kd values (derived using adsorption isotherms) could likely underestimate the impact of sorption during fate and transport modeling (for example, by underestimating the retardation factor or by overestimating the extent of desorption) (Schaefer et al. 2021). Schaefer et al. (2021) observed that the extent of desorption from soils exposed to PFAS decades ago generally was substantially less than predicted by published Kocfoc relationships for the PFAS studied, suggesting that desorption from old PFAS releases may have a less pronounced impact on underlying groundwater, particularly for shorter chain PFAS. Schaefer et al. (2022) noted that much of the PFAS present in soils historically impacted with AFFF in their study was not readily leachable using the selected desorption procedure(s).
5.2.3.5 Nonlinear Sorption, Hysteresis, and Mass Transfer Limitations
Sorption processes of PFAS can be impacted by nonlinear sorption, hysteresis, and mass-transfer limitations. Nonlinear sorption typically implies that PFAS will sorb more strongly at low PFAS concentrations than high concentrations. Counter to typical nonlinear sorption tendencies, at least one field study observed greater sorption at higher concentrations (Anderson et al. 2022). There is also some evidence that desorption may occur more slowly than sorption for certain PFAS, which is hypothesized to be the result of entrapment and diffusion limitations (Higgins and Luthy 2006; Chen et al. 2016; Zhi and Liu 2018; Xiao et al. 2019). Several studies have observed that select PFAS can be subject to rate-limiting sorption (for example, diffusion limited), meaning that desorption of a portion of the sorbed PFAS will occur more slowly than other portions (Xiao et al. 2019; Schaefer et al. 2021). For example, Brusseau et al. (2019) showed that PFOS exhibited nonideal sorption/desorption behavior (tailing). Kinetic desorption modeling in the study indicated “that the rate of desorption was proportional to the PFAS aqueous diffusivity” (Schaefer et al. 2021), supporting the hypothesis that diffusion may also limit the rate of release from soil. Any portion of the released PFAS that is strongly retained within sediments or the soil matrix may be more persistent but likely less bioavailable and less subject to migration. This hysteresis effect on a portion of the sorbed PFAS in soils may also be a contributor to sorption included in the rationale for natural attenuation of some PFAS that was evaluated by Newell et al. (2021).
PFAS partitioning due to electrostatic interactions has been shown to be nonlinear in some cases; Xiao et al. (2019) demonstrated that the variation in the coefficient of sorption for several zwitterionic PFAS to soils (for example, loams, clay loams) implies an increase in sorption as the PFAS concentrations decreased. The significant nonlinearity of zwitterionic PFAS observed by Xiao et al. (2019) also exhibited a high degree of hysteresis that was not related to soil organic matter or surface complexation and was postulated to be due to entrapment. For PFAS such as PFOA and PFOS that are anionic at environmentally relevant pH, measuring the anion exchange capacity in representative soils may serve as an indicator of the importance of electrostatic interactions with minerals. However, because soil pH can range considerably, pH can also serve as a useful measure of potential PFAS mobility. Measurements of cation concentrations or the ionic strength of an aqueous solution may also provide useful information on the potential contribution of electrostatic attraction to enhanced partitioning.
The findings discussed within this subsection are particularly relevant for strongly sorbing long chain PFAS such as PFOS (Chen et al. 2016) and sorbed PFAS that exhibit a high degree of hysteresis, such as zwitterionic PFAS, and have important implications for PFAS fate and transport such as leaching from soil to groundwater (see Section 5.3.3), migration and retardation in the saturated zone, and whether sorption can function as a form of natural attenuation (Newell et al. 2021, Newell et al. 2021) (see Sections 10.4.7 and 10.4.8, Table 10-1, and 12.6.8 for further discussion). Additional research is needed to further evaluate if any of these bulk parameters can be used predictively for fate and transport studies (Barzen-Hanson et al. 2017) and to understand the parameters’ role in irreversible sorption of PFAS that have been adsorbed for decades. Current research supports the conclusion that simple correlations of sorption with organic carbon or pH are insufficient to reliably predict PFAS partitioning coefficients for many PFAS. Thus, in the absence of a reliable model that predicts the role of different mechanisms on the extent of sorption (and hysteresis), site-specific data may be more appropriate for understanding PFAS transport (Knight et al. 2019; Anderson et al. 2016; Li, Oliver, and Kookana 2018) and considerations for pump-and-treat systems. Other considerations, such as air-water interface interactions, are discussed in Section 5.2.4.1.
5.2.4 Partitioning to Air
As discussed in greater detail in Section 4.2, reliable data on physical properties that relate to PFAS volatilization, such as vapor pressure and Henry’s law constants (Kaw), are currently limited but the data set is growing. Additionally, volatilization from water to air of acidic PFAS, such as PFAAs, is affected by pH-dependent, aqueous phase dissociation from more-volatile acidic species to less-volatile anionic species (Kaiser et al. 2010). Measured vapor pressures are available for some select PFAAs, including the acidic forms of PFOA, perfluorononanoic acid (PFNA), perfluorodecanoic acid (PFDA), perfluoroundecanoic acid (PFUnA), and perfluorododecanoic acid (PFDoDA) (Barton, Botelho, and Kaiser 2008; Kaiser et al. 2005), as well as FTOHs (Krusic et al. 2005). Henry’s law constants (Kaw) for several PFAS are reported in Section 4.2.6. As noted by the values provided in Table 4-1, Kaw can vary over multiple orders of magnitude for a given PFAS; underlying causes for the large range in reported values are not clear, but may relate to variability in measurement conditions. For some PFAS that are acidic at environmentally relevant pH, such as PFOS and PFOA, the reported vapor pressures are low and reported water solubilities are high, limiting volatilization from water to air (USEPA 2000). Other PFAS, such as FTOHs, have specific functional groups that tend to impart greater volatility. In one study performed by Roth et al. (2020), agitation of AFFF was demonstrated to release gas-phase PFAS, reportedly including PFOA. These experiments were performed in a controlled lab setting and resulted in detectable concentrations of five FTOHs and 10 PFCAs above background laboratory air concentrations. The potential for this type of partitioning to occur in field settings was not evaluated, and the veracity of the PFOA detections has been debated (Titaley, De la Cruz, and Field 2020; Roth et al. 2020). Section 1.1.3.3 includes information about volatile PFAS. See also the PFAS and Vapor Intrusion Fact Sheet developed in 2025.
Under certain conditions, particularly within industrial stack emissions, or during fire suppression, incineration, or combustion, PFAS can be emitted and transported through the atmosphere. This can include volatiles like FTOHs that may be present in the gas phase (Thackray, Selin, and Young 2020) and anionic PFAS that may be sorbed to particulates (Ahrens et al. 2012). In the latter case, transport occurs through the association of anionic PFAS with airborne aerosols and other small particulates rather than direct partitioning to the gas phase. For example, PFOA and PFOS have been detected in airborne particulate matter in both urban and semirural areas, with PFOA dominant in the smaller, ultrafine particles and PFOS dominant in the larger, coarser fractions (Dreyer et al. 2015; Ge et al. 2017). These studies show that some PFAS can be adsorbed to particulates, likely reflecting the influence of local diffuse sources. As discussed in Section 5.3, removal of airborne PFAS can occur via wet and dry deposition processes that scavenge particle-bound PFAS or gaseous PFAS that has partitioned into water droplets (Barton, Kaiser, and Russell 2007; Dreyer et al. 2010). Wet deposition refers to the wash out of PFAS by rain droplets, where PFAS drops to the ground with no transfer of PFAS to the air (Barton, Kaiser, and Russell 2007). This has been shown to be a relevant mechanism for influencing airborne transport within a few kilometers downgradient of a major manufacturing source (Barton, Kaiser, and Russell 2007; Davis et al. 2007). Dry deposition is a naturally occurring process that depends on prevailing environmental conditions and particle characteristics. Since these deposition processes remove PFAS from the atmosphere, they can influence the location and magnitude of PFAS deposition to terrestrial and aquatic environments.
Kaiser et al. (2010) demonstrated the partitioning of PFOA to workplace air from water and dry surfaces. Partitioning to air from these substrates appears to depend on conditions within the substrate, with lower pH environments contributing more PFOA mass to air. The protonated acid form of PFOA has an elevated vapor pressure, which may explain these observations (Kaiser et al. 2005). Interestingly, these authors showed that more PFOA partitions from dry surfaces than from water and may contribute significantly to workplace exposures.
5.2.4.1 Partitioning to Air/Water Interfaces
As described above, PFAS often exhibit surfactant behavior because many display hydrophobic and hydrophilic properties. The impacts of these properties on transport are complex and are being actively investigated. By design, many PFAS will lower the interfacial tension and preferentially form films at the air-water interface (if present at elevated concentrations), with the hydrophobic carbon-fluorine (C-F) tail oriented toward the air and the hydrophilic head group dissolved in the water (Krafft and Riess 2015) (Figure 4-1). This behavior influences aerosol-based transport and deposition, and suggests that accumulation of PFAS at water surfaces will occur (Prevedouros et al. 2006).
This preference for the air-water interface has important implications for PFAS transport in the vadose zone, where unsaturated conditions provide significant air-water interfacial area (Brusseau 2018; Brusseau et al. 2019; Brusseau and Guo 2022). This includes the potential for enhanced retention in the vadose zone and the capillary fringe, which are the subject of significant ongoing research. For example, Brusseau (2018) showed that adsorption of PFOS and PFOA at the air-water interface can increase the retardation factor for aqueous-phase transport, accounting for approximately 50% of the total retention in a model system (well-sorted sand) with 20% air saturation. Section 1.3.1 includes information about vadose zone characterization and transport, including air-water partitioning and vadose zone modeling.
As a result, air-water partitioning may contribute to retardation of PFAS in unsaturated soils. Using field data, Anderson, Adamson, and Stroo (2019) reported that soils with higher clay contents were associated with lower soil-to-water concentration ratios for multiple PFAS. The authors surmised that perhaps the more likely explanation was that the higher water content within these clay-rich zones (relative to other depth-discrete zones with more coarse-grained material) decreased the air/water interfacial area available for PFAS partitioning and thus decreased overall soil retention. This pattern is also consistent with the potential for negatively charged clay surfaces to reduce anionic PFAS adsorption through electrostatic repulsion. Guo, Zeng, and Brusseau (2020) highlighted the influence of soil type on air-water interfacial accumulation as a retention mechanism in a modeling study that demonstrated retardation factors for PFOS under their experimental conditions as between 233 and 1,355 in sands and 146 and 792 for finer-grained soils. This was attributed to weaker capillary forces in the sands that resulted in lower water contents and thus more air-filled pore space to promote PFAS partitioning. Note that the simulations performed by Guo, Zeng, and Brusseau (2020) examined only PFOS and did not use field-derived input parameters, so caution should be exercised when generalizing these results to the broader family of PFAS. In addition to the influence of soil type described above, ionic strength has been shown to affect air-water interfacial partitioning whereby PFAS retardation within unsaturated soils appears to be enhanced with increasing salinity (Lyu and Brusseau 2020; Costanza, Abriola, and Pennell 2020; Le et al. 2021).
The tendency for PFAS to accumulate at air-water interfaces has the potential to significantly influence mass retention and soil-to-groundwater leaching, as discussed further in Section 5.3.3.
This has stimulated interest in incorporating these processes into CSMs, as well as predictive fate and transport models. Estimates of the air-water interfacial area and the constituent-specific air-water adsorption coefficients, as well as direct measurements of mass discharge to groundwater, can help provide a quantitative basis for these types of models (Brusseau 2019; Guo, Zeng, and Brusseau 2020). In general, air-water adsorption coefficients for an individual PFAS decrease as the concentration increases, and the process appears to be nonlinear (for example, Freundlich-type partitioning) (Schaefer et al. 2019). Air-water adsorption coefficients also tend to increase as the number of perfluorinated carbons increases (Brusseau 2019; Schaefer et al. 2019) (see Section 4.2). This means that when PFAS are released as a multicomponent mixture, these processes will influence each compound to a different extent, with less retention of shorter chained PFAS (for example, PFBS, PFPeA) than longer chained PFAS (for example, PFOS, PFDA, PFNA) (Silva, Martin, and McCray 2021). Silva, Martin, and McCray (2021) also showed that preferential adsorption of the more surface-active PFAS within a mixed release is expected to reduce the adsorption of the other, less surface-active PFAS in the mixture. This type of competitive adsorption would influence the relative breakthrough times for different PFAS within a mixed release.
The potential retention of PFAS in the vadose zone due to adsorption at the air-water interface is an important component that should be addressed in the CSM, but the retention of PFAS is based on site-specific factors. At sites with shallow groundwater tables, or sites where the water content within the vadose zone soils is typically low, air-water interfacial partitioning may not be particularly relevant. As such, detailed site investigations are critical to understanding how these processes influence PFAS migration through the vadose zone of a specific site. For example, an extensive study of PFAS concentrations in soil at contaminated sites indicated significant retention of PFAS in the vadose zone over long periods of time, but vertical migration of PFAS to the water table was also evident, resulting in detectable PFAS in groundwater at a majority of the investigated sites (Brusseau 2020).
5.2.5 Partitioning into NAPL Co-Contaminants
PFAS and petroleum hydrocarbon fuels in the form of NAPLs may commingle at fire training areas, fire response sites, and other locations where fuels were used or disposed concurrently with PFAS-containing materials. In these settings, the released petroleum hydrocarbon fuel forms a NAPL into which the PFAS may partition and accumulate along the NAPL/water interface (Brusseau 2018). These processes may result in increased PFAS mass retained in NAPL source zones, increased PFAS sorption onto the NAPL/water interface and resulting retardation, and greater persistence of PFAS (Guelfo and Higgins 2013; McKenzie et al. 2016; Brusseau 2018). The contribution of this process relative to other PFAS partitioning mechanisms (for example, solid phase, air-water interface) will vary based on site-specific conditions. However, several studies have suggested that the PFAS mass accumulating at the NAPL-water interface is likely to be less than that at the air-water interface in systems where all these phases are present (Brusseau 2019; Silva et al. 2019; Costanza, Abriola, and Pennell 2020). The Priority Topics for Fate and Transport, Surface Water, Source ID, and Site Characterization include information about co-contaminant effects on PFAS fate and transport (see Section 1.3.4.1).
The presence of NAPL may have other effects on PFAS. The presence of biodegradable NAPL, such as petroleum light nonaqueous phase liquids (LNAPLs), may significantly alter the biogeochemistry and oxidation-reduction conditions in the subsurface. For example, subsurface petroleum LNAPLs remaining from a petroleum-based fire tend to locally deplete the concentration of oxygen and other electron acceptors and elevate the concentration of methane. The LNAPL creates a localized zone of anoxic reducing conditions where PFAS aerobic transformation processes are inhibited, and anaerobic transformation processes may occur. These transformation processes are discussed in more detail in Section 5.4.
5.3 Media-Specific Migration Processes
The potential impacts of processes such as diffusion into low-permeability matrices, atmospheric transport, and leaching from soil to groundwater are described. Unlike partitioning processes, which involve the exchange of chemicals between media, the following describes processes that occur within specific media that may be important considerations for PFAS migration.
5.3.1 Diffusion In and Out of Lower Permeability Materials
Diffusion is the movement of molecules in response to a concentration gradient. Diffusion in groundwater is often ignored because diffusion rates are slow relative to advection. In low permeability materials, migration of contaminants is mainly driven by molecular diffusion, and advective effects may be less dominant depending on the magnitude of hydraulic gradient. In the vicinity of groundwater pumping wells, analysis might need to be conducted by taking into account both the effects of molecular diffusion and advection simultaneously (Al-Niami and Rushton 1977). However, contaminant mass in groundwater can diffuse into the pore space of lower permeability soils or bedrock. Back-diffusion out of these low permeability materials may result in the long-term persistence of PFAS in groundwater even after source removal and remediation. Due to the lack of degradation of PFCAs and PFSAs, back-diffusion of these PFAS is also likely to be a more significant process than for conventional contaminants such as chlorinated solvents. Adamson et al. (2020) reported that approximately 82% of the total mass of PFAS measured at an AFFF site was found within soils that were classified as lower permeability. This included 91% of the polyfluorinated precursor mass, most of which was encountered in the vicinity of the presumed source area. The mass distribution at this site confirmed that diffusion into lower permeability soils had occurred and demonstrated that this process can contribute to long-term retention of PFAS. The relative impact of PFAS accumulation at the air-water interface was not fully investigated in this study, as the water table was very shallow, and the unsaturated/saturated transition zone was likely disturbed during excavation. PFAS may also diffuse into site materials such as concrete. For example, Baduel, Paxman, and Mueller (2015) reported that PFAS had penetrated 12 cm into a concrete pad at a fire training area, and diffusion was identified as a contributing process.
The potential impacts of diffusion on PFAS persistence in natural soils are a topic of ongoing research. Determining appropriate diffusion coefficients for the range of PFAS that may be present following a release is a key element in understanding how this process impacts PFAS persistence. Schaefer et al. (2019) reported experimentally derived diffusion coefficients for 9 different PFAAs and showed that aqueous diffusivity values decreased as the PFAS molar volume increased. However, this relationship was nonlinear due to the complex molecular interactions of fluorinated compounds, and the values showed reasonable agreement with some but not all comparable methods of deriving diffusion coefficients. In addition, the relative rates of diffusion of PFAS with differing charges (for example, anionic vs. zwitterionic/cationic) is a potential concern given that porous media particles may also be charged. In the study by Adamson et al. (2020) described above, 93% of the polyfluorinated mass that had diffused into the lower permeability zones was zwitterionic and/or cationic; a smaller percentage of the anionic polyfluorinated mass was found in these zones. Higher organic carbon and favorable electrostatic interactions likely contributed to further retention of PFAS. The results of this study suggest that matrix diffusion may enhance long-term retention and reduce PFAS mass discharge rates by transferring PFAS mass to less-transmissive zones.
5.3.2 PFAS Transport via Air
Many PFAS have been measured in air (Section 6.1) and are known to be released to air from a variety of sources (Section 2.6). Air serves as an important transport medium for PFAS, allowing PFAS to disperse in all wind directions, contributing to global dispersion, and leading to localized PFAS deposition to soils and surface water in the vicinity of emission sources (for example, (Shin et al. 2012)) which is of potential concern to site investigations. Section 1.1.3.3 includes information about volatile PFAS. See also the PFAS and Vapor Intrusion Fact Sheet developed in 2025.
The role of atmospheric transport depends on PFAS-specific properties such as vapor-particle partitioning, and mechanisms can be complex. Aerosols, representing a suspension of solid particles and liquid droplets in the air, provide a variety of environmental media and surfaces within or upon which a range of PFAS partitioning behavior can be observed. For example, McMurdo et al. (2008) described the release of concentrated PFAS aerosols from a water surface (where PFAS are often located). Airborne transport of PFAS is a potentially relevant migration pathway due to the common types of industrial release (for example, stack emissions). The specific means of PFAS releases from industrial sources have not been extensively studied, but could involve processes such as droplet mobilization from drying and agitation of liquid surfaces.
PFAS and other harmful air pollutants, including fluorinated products of incomplete combustion (PICs), can be released into the air from facilities that treat PFAS in air and solid media, such as incinerators, cement and lightweight aggregate kilns, sewage sludge incinerators, municipal waste combustors, soil desorbers, pyrolyzers, and spent carbon reactivation facilities (Krug et al. 2022; Riedel et al. 2021; Stoiber, Evans and Naidenko 2020). Few comprehensive waste characterization or full-scale demonstration studies have been conducted to document the performance of these treatment facilities in removing and destroying PFAS. In one recent study conducted under typical operations at a full‐scale spent carbon reactivation facility, researchers reported full removal of PFAS compounds from the spent carbon and >99.99% destruction of PFAS compounds through the reactivation facility furnace and air pollution control systems (DiStefano et al. 2022). The importance of other sources, such as combustion emissions or windblown foam from fire training and fire response sites, may need to be assessed. Section 12.4 includes additional information about incineration.
Once airborne, PFAS can occur in a gaseous state or be incorporated within particulate matter or other aerosols suspended within the air. The composition of the gas phase will be dependent on the industrial process(es) contributing to emissions. Neutral volatile precursor compounds, such as FTOHs, are often the dominant PFAS present in the gas phase (see Section 17.1) and can account for at least 80% of the total PFAS mass in ambient air in an urban area (Ahrens et al. 2012).
Over the open oceans and in remote regions, FTOHs also dominate neutral PFAS and almost all are present in the gas phase (Bossi, Vorkamp, and Skov 2016; Lai et al. 2016; Wang et al. 2015; Dreyer et al. 2009). In contrast, ionic PFAS, such as PFOA and PFOS, characterized by low vapor pressure and high water solubility, tend to be the dominant species found in airborne particulate matter. PFOA is associated with smaller, ultrafine particles, while PFOS is associated with larger, coarser fractions in both urban and semirural areas (Ge et al. 2017; Dreyer et al. 2015). Wet and dry deposition are the major mechanisms of removal of PFAS from the atmosphere and can occur from the scavenging of particle-bound PFAS or partitioning of gaseous PFAS to water droplets (Dreyer et al. 2010; Barton, Kaiser, and Russell 2007; Hurley et al. 2004). PFAS are commonly found in precipitation (rain and snow), with wet and dry deposition estimated to occur on a time scale of a few days (Chen et al. 2016; Lin et al. 2014; Taniyasu et al. 2013; Zhao et al. 2013; Dreyer et al. 2010; Kwok et al. 2010; Liu et al. 2009; Barton, Kaiser, and Russell 2007; Kim and Kannan 2007; Hurley et al. 2004). Certain PFAS, such as PFOS, have been found to persist in fine particulate matter (PM2.5) in the United States nearly 20 years after production was phased out, which confirms the presence of continuing sources (Zhou et al. 2021).
Atmospheric deposition can occur as dry or wet deposition, both of which are relevant for PFAS (Barton, Kaiser, and Russell 2007, 2010; Dreyer et al. 2010; Taniyasu et al. 2013). During dry deposition, PFAS that are preferentially associated with liquid or particle phases in air (aerosols) can be naturally deposited onto surfaces via settling, diffusion, or other processes. When precipitation contributes to washout of these PFAS-containing aerosols, the process is known as wet deposition. Wet and dry deposition are the major mechanisms for removal of PFAS from the atmosphere and can occur from the scavenging of particle-bound PFAS or partitioning of gaseous PFAS from water droplets (Dreyer et al. 2010; Barton, Kaiser, and Russell 2007; Hurley et al. 2004). Deposition is considered a sink term for the atmosphere because mass is removed and the potential for longer range atmospheric transport is reduced. However, this same process thus represents a potential source of PFAS to terrestrial and aquatic environments. Once settled, PFAS adsorbed onto soils or other surfaces (including indoor surfaces) can be resuspended when particulate matter is disturbed by wind or other physical means. See Section 6.1 for further discussion of atmospheric deposition of PFAS.
Short-range atmospheric transport and deposition can result in PFAS contamination in terrestrial and aquatic systems near points of significant emissions, impacting soil, groundwater, and other media of concern (Davis et al. 2007). PFAS can migrate downward from surficial soils into the groundwater table via leaching processes described in Section 5.3.3. Evidence of releases has been observed in areas where hydrologic transport could not plausibly explain the presence of PFAS in groundwater, with the extent of contamination reaching several miles from sources and in distribution patterns independent of regional hydrology (Frisbee et al. 2009; Post 2013; Post, Cohn, and Cooper 2012; NYS DOH 2016; NH DES 2017; VT DEC 2016). Air emissions from industrial sources can cause contamination of drinking water sources and pose a potential increased risk to human health in communities over wide areas surrounding the emissions source (Schroeder, Bond, and Foley 2021). Releases of ionic PFAS from factories are likely tied to particulate matter (Barton et al. 2006), which settles to the ground in dry weather and is are also wet-scavenged by precipitation (Slinn 1984; Sehmel 1984). Key variables that should be used to predict impacts to groundwater wells include the rate of PFAS air emissions and distance from upwind sources, prevailing wind direction, soil characteristics, and well depth (Roostaei et al. 2021). In a study using a statewide data set to model PFAS in private wells (n~2300), researchers found that proximity to point sources, including plastics, rubber, and textile industries, was the most important predictor of impacts, with groundwater recharge, precipitation, soil sand and clay content, and hydraulic conductivity as secondary predictors (Hu et al. 2021).
Predictive models have been applied to estimate PFAS deposition (D’Ambro et al. 2021; Shin et al. 2012). The American Meteorological Society/USEPA regulatory model AERMOD system contains modules to estimate both wet and dry deposition of both aerosols and gases (USEPA 2016). The Community Multiscale Air Quality (CMAQ) model has also been applied to investigate the atmospheric fate and transport of PFAS emissions (including GenX) from a fluoropolymer manufacturing facility in North Carolina (D’Ambro et al. 2021). In this study, researchers predicted that 5% by mass of total emitted PFAS and 2.5% of total GenX are deposited within ~150 km of the source, with the majority of emissions being transported beyond 150 km (D’Ambro et al. 2021). Model validation is important and where uncertainty exists, model predictions should be interpreted with caution. Nevertheless, the model may be useful in understanding the pattern of PFAS found in soil and groundwater in the vicinity of PFAS emission sources (Shin et al. 2012). Key input parameters for emissions from a smokestack or vent include the height of the release point and adjacent structures, source emission rates and particle size distributions, stack effluent properties (temperature and volumetric flow rate), meteorological data, local topography, and land use characteristics. A number of states are actively engaged in the application and review of air models for evaluating the impact of PFAS emissions from industrial sources and can provide valuable information on their use and the interpretation of findings.
Long-range transport processes are responsible for the wide distribution of neutral and ionic PFAS across the earth as evidenced by their occurrence in biota, surface snow, ice cores, seawater, and other environmental media in remote regions as far as the Arctic and Antarctic (Szabo et al. 2022; Langberg et al. 2022; Joerss et al. 2020; Yeung et al. 2017; Bossi, Vorkamp, and Skov 2016; Kirchgeorg et al. 2016; Rankin et al. 2016; Wang et al. 2015; Codling et al. 2014; Wang et al. 2014; Kirchgeorg et al. 2013; Kwok et al. 2013; Benskin, et al. 2012; Cai et al. 2012, 2012, 2012; Ahrens, Xie, and Ebinghaus 2010; Dreyer et al. 2009; Young et al. 2007). Geochemical modeling of the contributions of atmospheric and oceanic inputs in the Arctic suggests that atmospheric inputs may account for as much as 34%–59% of measured PFOA concentrations in the polar mixed layer (PML) (Yeung et al. 2017). Declining trends in the concentration of PFSAs in higher trophic arctic mammals has been largely attributed to reductions in long-range atmospheric transport as a result of industrial phaseout of certain PFAS (Routti et al. 2017). Distribution of PFAS to remote regions far removed from direct industrial input is believed to occur from both (1) long-range atmospheric transport and subsequent degradation of volatile precursors and (2) transport via ocean currents and release into the air as marine aerosols (sea spray) (Lin et al. 2021; Casas et al. 2020; Joerss et al. 2020; DeSilva, Muir, and Mabury 2009; Armitage et al. 2009; Wania 2007; Ellis et al. 2004).
5.3.3 Leaching
PFAS present in unsaturated soils are subject to downward leaching during precipitation, flooding, or irrigation events that promote dissolution and migration of contaminant mass (Sepulvado et al. 2011; Ahrens and Bundshuh 2014; Sharifan et al. 2021). This process can result in PFAS transport from surface soils to groundwater and surface water because PFAS releases often involve surface applications (for example, AFFF and biosolids) or atmospheric deposition (Borthakur et al. 2022; Gellrich, Stahl, and Knepper 2012; Anderson, Adamson, and Stroo 2019; Galloway et al. 2020). Section 1.3.1 includes information about vadose zone characterization and transport, including air-water partitioning and vadose zone modeling. Section 10.4.1 and Section 1.5.1 include information about approaches, methods, and tools available to evaluate PFAS leachability.
PFAS migration from shallow soils to groundwater is influenced by several interacting processes, which may enhance or limit PFAS leaching rates. The leaching potential will be enhanced in areas with high water infiltration rates, which may include natural water sources such as precipitation or human-made sources such as irrigation. The thickness of the unsaturated zone (depth to water table) will also affect leaching potential. These factors are consistent with other (non-PFAS) contaminants in shallow soils. Conversely, several PFAS-specific processes, as described in Section 5.2, potentially limit the extent of PFAS leaching from shallow soil to groundwater. These include partitioning of PFAS to solid phases (for example, soil particles), adsorption at the air-water interface, and partitioning to NAPL. As a result, any soil properties that enhance the potential relevance of PFAS-sorptive processes may limit soil-to-groundwater leaching. This includes elevated levels of organic carbon, surface area and surface charge, increasing air content, and higher ionic strength within the vadose zone (Guelfo and Higgins 2013). The structural properties of the individual PFAS will also influence their transport, including the tendency for longer chain PFAAs to be less soluble and exhibit larger partitioning coefficients than shorter-chain PFAAs. In addition, several of these partitioning processes within the vadose zone have been shown to be nonlinear, which means that their relative contribution to leaching may change over time as concentrations change as a result of dilution and transformation (Zeng and Guo 2021). Finally, site conditions that influence the degree of flushing (for example, precipitation rates and depth to groundwater) should be considered when evaluating the potential for PFAS to leach from soil to groundwater.
While our understanding of these vadose zone processes continues to evolve, there are several possible implications that may be relevant for managing sites where PFAS have been released:
- These processes can affect the rate at which some PFAS migrate through the vadose zone to groundwater (breakthrough). As with hydrophobic partitioning, the relative importance of air-water interfacial partitioning is highly dependent on hydrogeologic and geochemical properties (for example, water content, salinity) of the formation (Anderson, Adamson, and Stroo 2019), as well as the air-water interfacial affinity of individual PFAS (Brusseau 2019). In general, air-water interfacial partitioning can contribute to the bulk soil retention of PFAS in a manner that is unique among organic contaminants. Time scales required for PFOS (and other PFAS that exhibit strong interfacial adsorption characteristics) to reach the underlying groundwater have been simulated to be from 1 or 2 years to several decades or longer. The extent of this retardation factor will likely vary due to climate conditions and PFOS concentrations (Guo, Zeng, and Brusseau 2020; Brusseau 2020). This potential retardation could influence the selection and implementation of remedies, or even the duration of long-term management programs.
- Similar to the impact described above, retention within the vadose zone can occur because of the PFAS tendency to be associated with the air-filled pore space and (to a lesser extent) the solid phase, such that a limited portion of PFAS mass may be in the aqueous phase and subject to deeper infiltration (Guo, Zeng, and Brusseau 2020). Importantly, the interaction between solid phase sorption (hydrophobic partitioning and electrostatic interactions) and air-water interfacial partitioning could be important given that mass transfer limitations can create hysteretic desorption from soils with relatively high organic matter content (Schaefer et al. 2021).
Although some experimental and field-scale studies have reported PFAS transport by leaching (Lindstrom et al. 2011; Filipovic et al. 2015; Hellsing et al. 2016; Bräunig et al. 2017), others have observed long-term retention of longer chain PFAS on shallow soils after extended percolation (Sepulvado et al. 2011; Stahl et al. 2013; Anderson et al. 2016; Anderson 2021; Anderson et al. 2022). In a long-term lysimeter study using a silty soil with some clay and natural rainfall, PFOA and shorter chained PFCAs and PFSAs traveled more rapidly through the soil column than did PFOS (Stahl et al. 2013). However, even after 5 years, 96.88% and 99.98% of the mass of PFOA and PFOS, respectively, remained in the soil. This retention of PFOA and PFOS may increase the long-term persistence of the (soil-bound) source (Baduel, Paxman, and Mueller 2015). Due to the low (part per trillion) concentrations that are a concern in groundwater, slow leaching of PFAS from shallow soils may contribute to a persistent groundwater plume.
5.3.4 Transfer of PFAS between groundwater, surface water, porewater, and sediment
The interplay between PFAS and groundwater, porewater, surface water, and sediments is complex, and identifying the nature and implications of these interactions for PFAS fate and transport is very likely site-specific. The Priority Topics for Fate and Transport, Surface Water, Source ID, and Site Characterization include information about colloidal transport of PFAS in groundwater (see Section 1.3.4.2) and groundwater-surface water interactions (see Section 1.3.4.3).
For example, studies within the Little Neshaminy watershed in southeastern Pennsylvania indicate instances where PFAS-containing groundwater impacts surface water and other instances where surface water PFAS concentrations may be diluted by groundwater discharge (Leidos 2019; Tetra Tech 2022). Field investigations have also demonstrated the migration of PFAS from groundwater to surface water via infiltration of groundwater to stormwater utilities (Leidos 2019; Wood 2020). Other investigations have indicated transport of PFAS from groundwater to surface water features such as marshland (Aerostar SES 2021). Investigations involving larger tributaries also indicate that migration of PFAS from groundwater to surface water may be impacted by seasonal and local variations in stream flow that may affect groundwater flow direction and gradients (Weston-ER Federal Services 2022).
A complete understanding of fate and transport implications of transfer of PFAS between surface water and groundwater requires an understanding of the differing conditions between surface water, groundwater, and the hyporheic zone.
Development of surface water quality standards for PFAS is discussed in Section 16. Information about PFAS occurrence in surface water and groundwater is included in Section 6.4 and Section 6.3, respectively and in Section 17.1. Additional case studies of PFAS transport between surface water and groundwater are discussed in Section 15.5.
5.3.4.1 Groundwater/Surface Water Interactions
Surface water and groundwater often have distinct chemistry or geochemistry, including differences in pH, ionic concentrations, dissolved oxygen, and sources and concentration of PFAS or other contaminants. Sediment porewater represents the boundary layer between groundwater and surface water where geochemical and redox transition zones may have significant fate implications for PFAS.
To date, there are very limited studies of PFAS at the surface water/groundwater boundary. One of the few published studies, Tokranov et al. (2021), looked at the PFAS concentrations, dissolved oxygen, and nutrients in downwelling of lake surface water. They found that precursor concentrations decreased from surface water to groundwater across the porewater boundary and attributed this decrease to biotransformation and sorption.
Redox gradients at the sediment porewater zone are expected to impact the fate of PFAA precursors (for example, from anoxic groundwater flow into surface waters). Reaeration of anoxic groundwater during exfiltration to surface water will lead to shifts in microbial populations, which in turn may alter transformation of PFAA precursors. An analogous process occurred when increased PFAAs were detected after biosparging in the field (McGuire et al. 2014) and in column studies (Nickerson et al. 2021; also see Section 5.4.4.2 and the case study in Section 15.1.1). This suggests groundwater/surface water redox transition zones have potential as hotspots for biotransformation. Additional abiotic transformations may also occur in anoxic groundwater to aerobic surface water boundaries.
There is limited information on how redox gradients impact PFAS sorption. However, aerobic transformation of PFAA precursors yields more mobile products (Weber et al. 2017), which in turn might be less likely to be adsorbed to solid phases. In addition to the impacts on precursor transformation, the perfluorocarbon chain length “head group, and a variety of environmental properties (for example, sediment organic carbon content, mineral and grain coating composition, pH, aqueous calcium and humic acid concentration) have all been shown to influence PFAS partitioning in laboratory experiments” (Tokranov et al. 2021). For example, Steffens et al. (2021) found that measured PFOS concentrations decreased significantly in ionic solutions due to an apparent “salting out” effect. The decrease in bulk solution PFOS concentrations with higher salinity was attributed to increased uptake of PFOS on the water-container interface, as well as increased aggregation at the air-water interface. The authors suggest that such an effect has implications on transport of PFAS in high-salinity environments or in areas where changes in salinity occur spatially or temporally, as increased salinity may lead to aggregation of PFAS on particulates, sediment, or other solids, as well as increased concentrations of PFAS in surface microlayers.
It is difficult to estimate the extent of PFAS introduction to surface waters from groundwater, especially when there are other surface point discharge sources, or transformation and sorption processes might significantly impact PFAS transport. However, Pétré et al. (2021) studied a site without direct outfalls of PFAS onto surface water and based on groundwater and surface water field measurements estimated up to 32 kg/yr for perfluoroether carboxylic acids (PFECAs) released from hyporheic exchange. Because of the high mobility and low retardation factor of PFECAs, the authors assumed low sorption and not enough time for transformation (days to months) assuming no transformation or sorption due to the low retardation factor of PFECAs. They indicated that adsorption would overestimate PFAS flux to surface water, and desorption would underestimate it.
5.3.4.2 Surface Water/Sediment Interactions
PFAS, particularly short chain PFAS, are mobile in the aquatic environment due to their high solubility in water (Ahrens 2011). This property further increases the difficulty of finding a correlation between concentrations in water, especially flowing water, and other media, such as sediments, fish, or invertebrates (Campo et al. 2016). A number of studies have sought to establish PFAS partitioning between surface water and sediments in lakes or other stationary water bodies, such as wetlands and estuaries (White et al. 2015; Mussabek et al. 2019; Bai and Son 2021; da Silva et al. 2022).
Occurrence of PFAS in sediments can be the result of transfer (partitioning) from the surface water column or deposition of PFAS sorbed to suspended solids. The relative contribution of each process in PFAS transport to sediments remains unclear as partition coefficients measured in the field are consistently higher than those measured in the laboratory (Zhang et al. 2015; Li, Oliver, and Kookana 2018; Rovero et al. 2021). Suspended solids originating from erosion of PFAS-impacted soil may contain much higher levels of PFAS compared to suspended solids with PFAS due to equilibrium deposition (Borthakur et al. 2021; Xiao et al. 2019). These suspended solids, eroded from PFAS-impacted soils, may mix with particulates present in rivers and streams through turbulent mixing and may lead to higher PFAS concentrations in sediment when the suspended solids settle.
Dated sediment core analysis allows estimation of deposition rates and fluxes of PFAS to surface water bodies. Studies in the Great Lakes suggest it may be effective for long-chain PFAS that exhibit greater sorption to sediment, with concentration at a given depth interval representing deposition during that time period. Short-chain PFAAs showed less sorption and were apparently more mobile in the sediment column, and therefore were not effective indicators of PFAS deposition rates. The authors (Codling et al. 2018) also noted that as more short-chain PFAS are used as replacements for PFAS applications, sediment cores may have less utility for evaluating trends in deposition rates. Age-dated sediment cores in a Swedish study (Mussabek et al. 2019) allowed estimation of deposition rates and fluxes of PFAS to ponds impacted by AFFF releases. The study identified peak deposition rates occurring between 2003 and 2009, which correlated with reported activity near the water bodies. The study noted that interpretation of fluxes must consider seasonal variations in water chemistry, sedimentation, and partitioning (Mussabek et al. 2019). Heavy precipitation or storm events can also contribute to episodic or enhanced transport of sediment and resuspension or redistribution of contamination in some environmental settings. Resampling of marine sediment locations in Florida following the passage of a hurricane found sediment concentrations of total PFAS decreased 47% averaged across nine sites (Ahmadireskety et al. 2021). Sediments can also influence surface water concentrations. Tributary sediments with a mix of potential sources were shown to be potential secondary sources of PFAAs once those sediments were transported to a receiving water body (Balgooyen and Remucal 2022).
Because PFAS concentrations in sediment may be the result of average deposition conditions of discharges that may be episodic, passive porewater samplers may be useful to characterize the surface water concentrations and correlate them with the sediment PFAS concentrations. Passive sampling provides an accumulation of contaminants and so generates a time-weighted mean concentration instead of a snapshot of concentration at a discrete time point. However, careful consideration must be given to the type of sampler, as equilibrium devices may not be appropriate for episodic discharges and accumulation devices could potentially represent the average concentrations in sediments. See Section 11.1.7 for more information about sampling environmental media.
In a recent study, PFBS, PFHxS, and PFOS in sediments collected from lake Sänksjön near Ronneby, Sweden, was found to be correlated to the sediment mineral content (Fe, Pb, Rb, and As) but not with the fraction of organic carbon (foc) based on principal component analysis (Mussabek et al. 2020). Other PFAS measured at the site (PFHxA, PFOA, and 6:2 FTS) had weaker associations with the mineral content. The sorption behavior of PFAS to sediments depends on both hydrophobicity and electrostatic interactions given the unique structure of PFAS with both polar and nonpolar moieties (Ahmadireskety et al. 2021; Lampert 2018). Sorption of PFAS to sediments is expected to be driven by similar variables as partitioning in soils. See Section 5.3.2 for additional discussion of factors driving partitioning and sorption. In aquatic environments and the hyporheic zone, sorption and desorption are likely to have direct effects on the mechanisms of PFAS transport (for example, transport in dissolved phase, retention due to sorption, or particulate transport due to sorption).
5.4 Transformations
The Priority Topics for Fate and Transport, Surface Water, Source ID, and Site Characterization include information about perfluoroalkyl acid precursor biotransformation (see Section 1.3.3). In addition, a new tab named Biotransformation was added to the Physical and Chemical Properties Table (Table 4-1). The biotransformation table includes a compilation of available precursor kinetics data (see Section 1.3.3.2).
5.4.1 Introduction
Numerous studies have reported both biotic and abiotic transformations of some polyfluorinated PFAS. Polyfluorinated PFAS shown to transform are referred to as precursors and typically form PFAAs. However, PFAAs have not been shown to degrade or otherwise transform under ambient environmental conditions. The fundamental differences between polyfluorinated precursors and perfluorinated chemicals that affect transformation potential are the presence, location, and number of carbon-hydrogen (C-H) bonds and potentially carbon-oxygen (C-O) bonds throughout the alkyl carbon chain. Specifically, PFAS with C-H bonds are subject to a variety of biotic and abiotic reactions that ultimately result in the formation of shorter chain PFAAs. Although available studies on both biotic and abiotic transformation of polyfluorinated PFAS primarily consist of controlled laboratory experiments (discussed below), an increasing number of field studies have also been published that demonstrate the relevance of precursors at a variety of sites with different source scenarios (for example, Weber et al. 2017; Dassuncao et al. 2017).
5.4.2 PFAA Precursors
Although PFAAs are limited to a fairly small number of homologous compounds that differ only with respect to carbon chain length and the terminal functional group, the number and diversity of polyfluorinated chemicals is vast. Thousands of PFAS are currently thought to exist (or have existed) on the global market, and the vast majority are polyfluorinated (Wang et al. 2017) (Section 2). However, transformation studies published to date are available for only of a small subsample of these PFAS, and therefore, much uncertainty exists regarding 1) the extent to which precursor transformation occurs on a global scale, 2) which environmental compartments represent the majority of transformation, 3) relevant environmental conditions that affect transformation processes, and 4) transformation rates and pathways. Nevertheless, the fraction of total PFAS that consists of PFAAs, both globally and (in particular) at contaminated sites, should be expected to increase due to transformation over time, over distance, and due to remediation, as depicted in Figure 5-3.
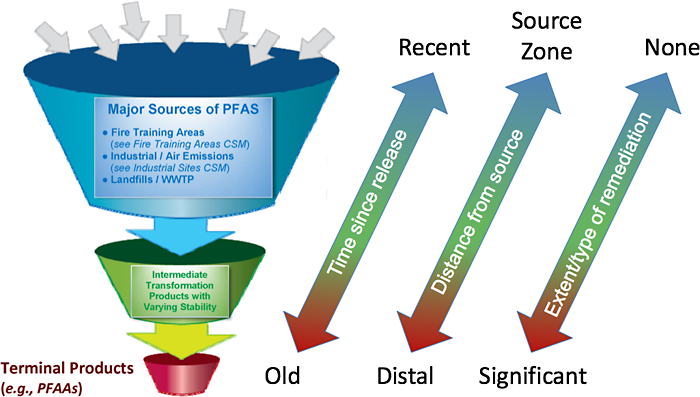
Figure 5-3. Illustration of precursor transformation resulting in the formation of PFAAs.
Source: L. Trozzolo, TRC, and C. Higgins, Colorado School of Mines. Used with permission and based on This Photo by Unknown Author is licensed under CC BY-SA.
5.4.3 Atmospheric Transformations
Although direct emission of PFCAs has declined globally, atmospheric emission of PFCA precursors has been increasing (Thackray and Selin 2017; Wang et al. 2014). Similarly, emission rates for PFSA precursors are increasing globally (Löfstedt Gilljam et al. 2016). Atmospheric transport is an important distribution mechanism for PFAS on both regional and global scales, which has led to documented PFAS occurrence (including PFAAs and PFAA precursors) in remote locations, including arctic regions (Young et al. 2007). Ocean currents also transports PFAS to arctic regions, although the relative contribution of each mechanism is not well understood (Yeung et al. 2017). Regardless of the relative contributions of atmospheric and oceanic transport, atmospheric transport and subsequent transformation of precursors has been documented as an important source of PFAAs in the environment (Young et al. 2007).
Widely measured PFCA precursors in the atmosphere include primarily FTOHs (Thackray and Selin 2017; Young and Mabury 2010; Martin et al. 2002). Wang et al. (2015) collected marine atmospheric samples during an expedition research cruise that spanned the Southern Ocean, Atlantic Ocean, and Arctic Ocean; samples were analyzed for several precursors, including FTOHs, FTAs, FOSAs, and FOSEs. The researchers found that FTOHs were the predominant species.
Atmospheric transformation of precursors, including FTOHs, may be an important source of PFCAs in the environment, such as those identified in the Arctic (Schenker et al. 2008). Although direct photolysis of PFAS has not been observed, indirect photolysis of some precursors does occur in the atmosphere and can be a significant contributor to PFCA deposition (Armitage, MacLeod, and Cousins 2009; Yarwood et al. 2007). For example, hydroxyl and chlorine radicals degrade 8:2 FTOH to PFOA in the atmosphere through reactions with hydroxyl and chlorine radicals, with similar reactions for 6:2 and 4:2 FTOHs (Ellis et al. 2004) and perfluoroalkyl sulfonamides, which may degrade to PFCAs and PFSAs (atmosphere) (Martin et al. 2006) and PFSAs (terrestrial environment) (Mejia Avendaño and Liu 2015). In addition to FTOH, other semivolatile precursors may also undergo atmospheric transformation to PFCAs (Young and Mabury 2010).
Atmospheric transformation of precursors to PFCAs is a multistep process, and the PFCA product yield is a function of several factors, including ratio of nitrous oxides (NOx) and peroxy radicals (RO2) species. High NOx levels result in lower long-chain PFCA yields, thus long-chain PFCA yields are typically higher in remote regions (Young and Mabury 2010). Thackray and Selin (2017) calculated theoretical maximum yields for formation of PFOA and PFNA from 8:2 FTOH that were highly variable, ranging from far less than 1% to 40% (PFOA) or 80% (PFNA), depending on local photochemical conditions.
5.4.4 In Situ Transformations
5.4.4.1 Abiotic Pathways
Abiotic processes shown to cause transformations of precursors in soil and water under ambient environmental conditions include hydrolysis, photolysis, and oxidation. Hydrolysis of some precursors, followed by subsequent biotransformation, can produce PFSAs. An important example is the production of PFOS from perfluorooctane sulfonyl fluoride (POSF) (Martin et al. 2010). Other hydrolysis reactions produce PFCAs. In particular, Washington and Jenkins (2015) showed that the hydrolysis of fluorotelomer-derived polymeric precursors forms monomeric precursors of PFOA and other PFCAs with half-lives of 50–90 years at neutral pH. Also, oxidation of precursors by hydroxyl radicals can occur in natural waters, with the fluorotelomer-derived precursors being oxidized more rapidly than electrochemical fluorination (ECF)-derived precursors (Gauthier and Mabury 2005; Plumlee, McNeill, and Reinhard 2009). Shorter chain PFCAs as well as PFSAs such as perfluorobutane sulfonate (PFBS) also can be produced by oxidation reactions between hydroxyl radicals and sulfonamido derivatives (D’Eon et al. 2006). Finally, in some cases, abiotic precursor transformations may not initially produce any PFAA (for example, the formation of various polyfluorinated sulfonamido intermediate compounds from ECF-derived precursors), though eventual formation of PFAAs may still be possible.
5.4.4.2 Aerobic Biological Pathways
Evidence of aerobic biotransformation is provided from studies of PFAS composition throughout the continuum of wastewater treatment (see Arvaniti and Stasinakis (2015) for a comprehensive review), field studies at AFFF-impacted sites (for example, Houtz et al. 2013; McGuire et al. 2014; Anderson et al. 2016; Weber et al. 2017), and most authoritatively from microcosm experiments.
The literature on aerobic biotransformation collectively demonstrates, or indirectly supports, conclusions such as the following:
- Numerous aerobic biotransformation pathways exist with relatively rapid kinetics.
- All polyfluorinated precursors studied to date have the potential to aerobically biotransform to PFAAs.
- Aerobic biotransformation of various fluorotelomer-derived precursors exclusively results in the formation of PFCAs, including PFOA.
- Aerobic biotransformation of various ECF-derived precursors primarily results in the formation of PFSAs, including PFOS.
In detail, most commonly studied in microcosm experiments have been the 6:2 and 8:2 FTOHs in soil, sludge, or aqueous matrices. Although observed degradation rates and intermediates are variable among these studies, ≤ C8 PFCAs have been consistently observed as terminal transformation products (Dinglasan et al. 2004; Wang et al. 2005, 2005; Liu et al. 2007; Saez, de Voogt, and Parsons 2008; Wang et al. 2009). However, a pure culture experiment with P. chrysosporium (a white-rot fungus) reported much lower PFCA yields with alternate pathways (Tseng et al. 2014). Other telomer-derived polyfluorinated PFAS investigated include the 6:2 fluorotelomer mercapto alkylamido sulfonate (Weiner et al. 2013), the 6:2 fluorotelomer sulfonate (Wang et al. 2011), the 4:2, 6:2, and 8:2 fluorotelomer thioether amido sulfonates (Harding-Marjanovic et al. 2015), the perfluorooctane amido quaternary ammonium salt (Mejia-Avendaño et al. 2016), the 6:2 fluorotelomer sulfonamide alkylamine, and the 6:2 fluorotelomer sulfonamide alkylbetaine (D’Agostino and Mabury 2017). All demonstrate the formation of PFCAs with variable rates and inferred pathways. Aerobic biotransformation of various ECF-derived polyfluorinated PFAS has also been demonstrated in several studies. Studied PFSA precursors include N-ethyl perfluorooctane sulfonamido ethanol (Rhoads et al. 2008; Zhao et al. 2016; Zhang et al. 2017), N-ethyl perfluorooctane sulfonamide (Mejia Avendaño and Liu 2015), and perfluorooctane sulfonamide quaternary ammonium salt (Mejia-Avendaño et al. 2016). All demonstrate formation of PFSAs with variable rates and inferred pathways.
5.4.4.3 Anaerobic Biological Pathways
Few studies have been published to date conclusively demonstrating biotransformation of per- and polyfluorinated PFAS under anaerobic conditions. Different end-products of PFAA precursors have been observed between aerobic and anaerobic conditions (Choi et al. 2022). Aerobic, and to some extent, denitrifying conditions lead to PFAAs (Yi et al. 2022), but more reducing anaerobic conditions, such as iron- and sulfate-reducing, lead to other transformation products (Yi et al. 2018; Yan et al. 2022). FTOHs were studied in two instances, demonstrating the production of stable polyfluorinated acids under methanogenic conditions with much slower kinetics relative to aerobic biotransformation (Zhang et al. 2013; Allred et al. 2015). In a recent study, PFOA and PFOS were demonstrated to be defluorinated by a specific microbial strain (Acidimicrobium sp. Strain A6) under conditions where ammonium is oxidized while iron is reduced, a condition known as Feammox (Huang and Jaffé 2019). The environmental significance of anaerobic biotransformations of polyfluorinated PFAS as sources of PFAAs is uncertain.
5.4.5 Polymer Transformation
Polymeric substances in the PFAS family include fluoropolymers, polymeric perfluoropolyethers, and side-chain fluorinated polymers (Buck et al. 2011). Detailed descriptions of these polymers appear in Section 2.2.2.1. Briefly,
- fluoropolymers are high–molecular weight solid plastics (> 100,000 Daltons, or Da according to Henry et al. (2018)) containing a carbon polymer backbone with fluorine directly attached to backbone carbon atoms.
- polymeric perfluoropolyethers contain an ether polymer backbone with F directly attached to carbon atoms. These polymeric PFAS are complex and mainly used as surfactants and surface protectants.
- side-chain fluorinated polymers contain a nonfluorinated polymeric backbone with fluorinated side chains; these are synthesized from telomer-derived precursors.
Polymer transformation research has indicated the following.
- Given the wide range of estimated half-lives, modeling assumptions for estimating the half-lives, different levels of residuals present in the polymer studied, highly variable molecular weights of the polymers studied with different surface area and size and with different extraction protocols, the polymer degradation studies are inconsistent.
- Other environmental conditions that need to be considered are redox, pH, temperature, percent moisture, and microbial activity in the soil microcosms for these long-term studies.
- Additional research is needed primarily on the biotransformation of side-chain fluorinated polymers, which are potential precursors to PFAAs.
Side-chain fluorinated polymers are widely used for many commercial and industrial applications as surfactant and surface-protecting products (Buck et al. 2011). Therefore, understanding the biotransformation potential of these polyfluorinated polymers is essential. However, few studies have reported on the potential biotransformation of side-chain polymers—for example, the fluorotelomer-based urethane polymer (Russell et al. 2010). Given the complexity of side-chain fluorinated polymers, there are many discrepancies among these studies. Primarily, the inability to monitor polymer concentrations is problematic. Because analytical methods for direct quantitation of polymers are not available, all the studies except Rankin et al. (2014) monitored suspected FTOH degradation products rather than the disappearance of the polymer (Wang et al. 2005; Liu et al. 2007; Wang et al. 2009; Dasu, Liu, and Lee 2012; Dasu and Lee 2016). Rankin et al. (2014) qualitatively monitored the disappearance of the polymer using matrix-assisted laser desorption/ionization time-of-flight (MALDI-TOF) mass spectrometry, in addition to monitoring known degradation products. Also, the presence of impurities or nonpolymerized residuals (monomers, oligomers, PFCAs, FTOHs, etc.) complicates data interpretation and potentially confounds conclusions on polymer biodegradation. Finally, the time frame for the biodegradability studies (max = 2 years) is much shorter than the extrapolated half-lives (decades to thousands of years) of these side-chain fluorinated polymers. Hence, modeling assumptions are also critical sources of variability.
Russell et al. (2008); Russell et al. (2010) investigated the biodegradation potential of two types of side-chain fluoropolymers, fluorotelomer-based acrylate polymer and urethane polymer in soils for 2 years. Based on the experimental data for PFOA, the estimated half-life of acrylate polymer was 1,200–1,700 years and of urethane polymer was 28–241 years (geometric mean of 102 years). However, the polymer used in this study contained high residuals. Later, Washington et al. (2009) studied the biodegradation potential of fluorotelomer-based polyacrylate, which contained low residuals, and based on the experimental data for PFOA, the acrylate polymer half-life was estimated at 870–1,400 years. Further, based on the assumption that degradation is surface-mediated, the authors also modeled and estimated the half-life for finely grained polymers, which are typical of commercial products. They did this by normalizing to the estimated surface area of the polymer and derived a half-life of 10-17 years, which suggests fine-grained, side-chain fluoropolymer products may be a potentially significant source of PFCAs to the environment. Washington et al. (2015) studied the biodegradability of commercial acrylate polymer for 376 days in soils using exhaustive extractions (Washington et al. 2014) and estimated half-lives ranging from 33 to 112 years. In this study, it was also observed that the acrylate polymer can undergo OH-mediated hydrolysis in pH 10 water and it degrades 10-fold faster than in the neutral treatment. This is the only abiotic transformation of side-chain fluorinated polymer reported in the literature, so the mechanism of abiotic degradation needs further investigation. Another research group, Rankin et al. (2014) studied the biodegradation of laboratory-synthesized fluorotelomer-based acrylate polymer in soil, plant, and biosolids for 5.5 months. Degradation rates were faster in plants and biosolids than in soils. Even in this study, a broad range of estimated half-lives of 8–111 years was reported. The modeling assumptions used in different studies lead to variability in reported half-lives (Russell et al. 2008; Russell et al. 2010; Washington et al. 2009, 2010, 2015, 2018).
5.4.6 Practical Implications
Precursor transformation can complicate CSMs (and risk assessments) and should be considered during comprehensive site investigations. For example, atmospheric emissions of volatile precursors can result in long-range transport where subsequent transformation and deposition can result in detectable levels of PFAAs in environmental media independent of obvious point sources (Vedagiri et al. 2018). Moreover, downgradient PFOA and PFOS groundwater concentrations, or downstream concentrations within treatment systems, can oftentimes be higher than near the source area/influent due to precursor transformation reactions such as oxidation. Also, PFOA and PFOS concentrations can exhibit an increasing trend over time as precursors transform with time and distance (Figure 5-3), which can influence the Remedial Investigation/Feasibility Study (RI/FS) scope and data evaluation.
With respect to site-related precursors, transformation of otherwise unmeasured PFAS into detectable PFAAs is obviously relevant to site investigations to the extent transformation occurs after initial site characterization efforts. Additionally, differential transport rates between precursor PFAS and the corresponding terminal PFAA could also confound CSMs if transformation rates are slower than transport rates, as has been suggested (Weber et al. 2017).
To account for otherwise unmeasurable precursors, several surrogate analytical methods have been developed, including the total oxidizable precursor (TOP) assay (Houtz and Sedlak 2012), particle-induced gamma-ray emission spectroscopy (PIGE) (Schaider et al. 2017), and adsorbable organic fluorine (AOF) followed by combustion ion chromatography (Wagner et al. 2013). For more information on these surrogate analytical methods to measure precursor concentrations, see Section 11.2.
5.5 PFAS Uptake into Aquatic Organisms
Some PFAS have a propensity to bioaccumulate. That is, they are taken up and accumulate in organisms from environmental media. Moreover, some PFAS may biomagnify up the food chain; for these compounds, lower levels of PFAS are observed in tissue from organisms at the base of the food chain and in lower trophic-level invertebrates and fish and higher tissue PFAS levels are observed in predatory fish and in air-breathing animals at the top of the food chain (for example, seagulls, polar bears) (Houde et al. 2011; Gobas, Kelly, and Kim 2020; Burkhard 2021). Trophic transfer of PFAS and biomagnification appear to be higher in air-breathing organisms (aquatic-dependent birds and mammals) than in gill-breathing species (for example, higher trophic-level fish species), presumably because the respiratory elimination of PFAS via gills to water is much greater than elimination from lungs to air (De Silva et al. 2021). It should be noted that not all PFAS biomagnify, and for some (for example, PFOS), the evidence regarding biomagnification is mixed (Franklin 2016). Section 1.3.5.4 includes information about bioaccumulation of PFAS in marine biota.
The major mechanisms controlling aquatic bioaccumulation of PFAS are uptake (from water and food), depuration (which includes elimination across the gill surface, urine, and in feces) (Chen, Gong, and Kelly 2016; Zhong et al. 2019), growth dilution, and biotransformation. Within organisms, the extent of accumulation differs among types of tissues (for example, whole body, muscles, liver).
An understanding of bioaccumulation in field populations rests on evaluation of the following factors, which are common to PFAS, as well as to other contaminants:
- Exposure concentrations (concentrations of PFAS in sediments and water)
- Exposure to precursors
- Trophic level (higher trophic levels often exhibit higher concentrations)
- Movement and migration patterns, which determine the extent of exposure to contaminated areas that lie within the home range of an organism
- Bioenergetics (respiration rate, growth rate)
- Toxicokinetics (gut uptake efficiency, gill transfer efficiency, fecal elimination, biotransformation rate, differential protein binding)
Unlike nonionic polar organic compounds, which accumulate in fatty tissues, the bioaccumulation of ionic PFAS in aquatic biota is generally characterized as associated with proteins. Several studies (Jones et al. 2003; Han et al. 2003) reported that PFOS and PFOA are generally bound to serum albumin, as well as proteins in the liver and kidney, and differences among tissues in type of protein explain much of the PFAS variation among tissues (Ng and Hungerbuhler 2014, 2015). Binding to phospholipids is another mechanism for PFAS accumulation (Dassuncao et al. 2019). Thus, methods and models that characterize the bioaccumulation of nonionic polar compounds by assuming partitioning to lipids (using lipid normalization) are likely to be inappropriate for PFAS (see discussion of partitioning in Section 4.2.10 ).
Bioaccumulation of PFAS is generally characterized using three parameters:
- Bioconcentration factor (BCF)—the direct uptake of PFAS by an organism from the water column (for example, through the gills). This is measured in the laboratory. It is defined as the ratio of the concentration in an organism to that in the exposure water (typically in units of ng/kg wet weight / ng/L, or L/kg wet weight).
- Bioaccumulation factor (BAF)—the amount of PFAS taken up from water plus the contribution of PFAS in the diet of the organism. Both the organism and its diet are simultaneously exposed to the same exposure sources. This is generally measured in the field. The units are the same as for the BCF.
- Biomagnification factor (BMF)—the increase in tissue PFAS concentration moving up the food chain, based on a specific predator/prey relationship. The BMF is measured in the field and is typically reported in units of ng/kg wet weight in predator / ng/g wet weight in prey. The trophic magnification factor (TMF) similarly describes the increase in tissue PFAS concentration with trophic level, but it is estimated using data for multiple trophic levels. It is typically calculated as a regression of log(PFAS concentration) vs. trophic level, which is usually determined using the stable isotope 15N method (Franklin 2016).
BCFs, BAFs, and BMFs are used to understand the nature of bioaccumulation; for example, they are used in the European Union REACH designation of compounds as “bioaccumulative” in the Persistent, Bioaccumulative, and Toxic (PBT) and Very Persistent and Very Bioaccumulative (vPvB) assessments. They are also used to support risk assessments and in development of surface water quality criteria (see Section 16). Publications addressing PFAS BCFs, BAFs, BMFs/TMFs are too many and too broad to cover in this document. Several publications have reviewed PFAS bioaccumulation, including but not limited to Burkhard (2021); Houde et al. (2006); Houde et al. (2011); Martin et al. (2013); Conder et al. (2020); Gobas, Kelly, and Kim (2020); and De Silva et al. (2021).
To support better understanding of PFAS bioaccumulation in aquatic species, available BCF and BAF data are provided in Table 5-1 (as a separate Excel file). BCF and BAF values for both invertebrates and fish are included. PFOS is the compound for which BCFs and BAFs are most commonly reported. This is expected because it is generally the most abundant PFAS in the tissues of aquatic organisms. The Table 5-1 Excel file consists of two sheets, the Database that reports values found in relevant literature and a Log sheet that lists each reference that was reviewed.
Table 5-1 includes BCF or BAF values reported in published studies that were compiled as of September 2021. All of the BCF studies were performed in the laboratory under controlled conditions, while the BAF studies were performed in the field. All studies were subject to quality review, which was performed in a qualitative manner. First, the table includes only BCF and BAF values that were reported in the publications. In some studies, PFAS concentrations were measured in water and biota, but BCF or BAF values were not reported. In such studies, BCF or BAF values may not have been reported due to several potential factors—for example, proper spatial and temporal matching of the data. In light of such uncertainties, BCF or BAF values were not calculated for the table. These studies are noted in the Log sheet, for the user’s consideration.
In addition, a number of studies were reviewed but not included in the Database sheet for various reasons; these studies are also indicated in the Log sheet (column “BAFs or BCFs presented in Table 5-1?”), and notes on each study are provided in the column “Comment.” A quantitative ranking was not conducted, along the lines of Burkhard (2021), who developed a parallel and largely overlapping database of BAF values and classified each study into one of three data quality categories based on several factors (number of fish and water samples, temporal and spatial coordination between the water and fish sampling, and general experimental design). Burkhard (2021) concluded that “The distributions suggest that there are not big differences across the three measurement quality rankings.” This suggests that the lack of a quantitative quality review of each study in Table 5-1, along the lines provided by Burkhard (2021), is not likely to be a significant limitation to the usefulness of the information. Additional information is provided in the README sheet of the Table 5-1 Excel file.
Information on best practices for conducting laboratory bioaccumulation tests is provided by OECD (2012), USEPA (2016), and ASTM (2013). Information is also available concerning the design and interpretation of field and laboratory BAF studies (for example, Burkhard 2003; Gobas et al. 2020). These resources may be useful in guiding the interpretation of the studies included in the database.
The following sections provide overviews of the available PFAS bioaccumulation data.
5.5.1 Bioconcentration
Table 5-1 presents available BCFs for several PFAS. Variation in the reported values is observed in the BCFs and is related to the specific PFAS, exposed species, tissue type, and other factors.
Studies have indicated that chemical structure, particularly the length of perfluoroalkyl chain and the presence of functional groups (carboxylate vs. sulfonate), influence their bioaccumulation potential. Martin et al. (2003) exposed rainbow trout to individual PFAS for 12 days. The PFAS with shorter perfluoroalkyl carbon chain lengths (< 7 for carboxylates and < 6 for sulfonates) had negligible BCFs. At 8–12 carbon chain length, uptake of PFAS compounds was proportional to the carbon chain length and inversely proportional to the critical micelle concentration (CMC; the concentration at which one half of the molecules are associated as micelles). Others have also shown that shorter chain PFCAs and PFSAs (less than eight and six carbons, respectively) are not readily bioconcentrated or accumulated (Conder et al. 2008; Martin et al. 2013; Houde et al. 2011).
Martin et al. (2003) also showed that PFSAs had greater BCFs and half-lives than the corresponding PFCAs of equal chain length, indicating that hydrophobicity, as predicted by the CMC, is not the only determinant of PFAS bioaccumulation potential and that the functional group must be considered.
With respect to tissue types, Martin et al. (2003) showed that PFAS accumulated to the greatest extent in the blood, followed by the kidney, liver, and gall bladder. Lower levels accumulated in the gonads, followed by adipose tissue and muscle tissue. This tissue-dependent distribution has been shown in many other studies and is apparently due to PFAS having a high affinity for serum albumin and fatty acid–binding proteins (Ng and Hungerbuhler 2014, as well as to binding to phospholipids (Dassuncao et al. 2019).
5.5.2 Bioaccumulation
Table 5-1 presents available BAF data for several PFAS. As shown, BAFs may be reported using concentrations measured in whole bodies or specific tissues. BAFs reported for fish muscle or fillet are useful for human health risk assessments (for fish consumption) and for developing corresponding water quality criteria (see Section 16). Whole-body BAFs can be used in ecological risk assessments for higher trophic organisms (for example, predatory fish, piscivorous birds and mammals) and developing corresponding water quality criteria. However, Conder et al. (2020) proposed using lab-derived BCFs instead of field-based BAFs in ecological risk assessments, primarily because lab-based BCFs are less variable and generally more reliable than field-based BAFs. Furthermore, PFAS associated with freshly spiked laboratory media may be more bioavailable than in the field, potentially leading to conservative BCFs (higher than what would occur under field conditions). Field-based BAFs may be affected by the presence of precursors (Langberg et al. 2020), making risk assessments and water quality criteria based on these BAF estimates unreliable. However, site specificity of field-based BAFs may be important to consider in specific situations, such as in the refinement of site-specific risk assessments and development of site-specific water quality criteria.
When comparing BAFs among organisms, or when developing statistical summaries of BAF values, differences among tissues in the extent of accumulation must be considered. The approach that is simplest, and which probably provides the most robust approach to comparisons of BAFs among organisms, is to report BAF values on a whole-body basis, since tissue-specific BAFs may vary among species due to differences in toxicokinetics. Such data may be collected using either whole-body samples or tissue-specific measurements that can be mathematically combined to yield equivalent whole-body concentrations. In aquatic organisms, PFAS concentrations in muscle are generally within a factor of two of whole-body concentrations (Goeritz et al. 2013; Shi et al. 2015).
Bioaccumulation of some PFAS has been observed in a variety of wildlife, generally fish-eating species, across the globe as demonstrated by the large number of studies reporting wildlife PFAS residues. Bioaccumulation data are now available for a wide range of environments, including water bodies directly adjacent to or downstream of manufacturers of PFAS, industries that use PFAS in manufacturing processes, firefighting, and wastewater treatment plants, as well as urban areas and areas distant from specific sources (De Silva et al. 2021). The majority of sampling has been conducted to support risk assessments and fish consumption advisories, as well as hypotheses concerning long-range fate and transport, temporal trends, and the identification of sources. Most of the work has been performed in the Northern Hemisphere, and some authors have found that levels are lower in the Southern Hemisphere (Armitage et al. 2009; Ahrens et al. 2009; Ahrens 2011; Benskin et al. 2012). One study in Australia, however, found among the highest PFOS concentrations reported worldwide in the livers of dolphins in heavily industrialized regions of South Australia (Gaylard 2017).
Some insights regarding PFAS bioaccumulation of PFCAs, PFSAs, and precursors are as follows:
- Similar to bioconcentration, bioaccumulation of PFAAs depends on carbon chain length (Brendel et al. 2018]). USEPA (2017) considers PFCAs with less than seven perfluorinated carbons (PFCAs shorter than PFOA) and PFSAs with less than six (such as PFBS) to less bioaccumulative. PFSAs are more bioaccumulative than PFCAs of the same carbon chain length.
- Bioaccumulation and biomagnification factors measured in the field vary widely (Franklin 2016; Gobas, Kelly, and Kim 2020; Burkhard 2021). Some PFAAs exhibit BAFs that overlap the range often used as criteria for bioaccumulation, for example by USEPA, Canada, and the European Union (1,000–5,000 L/kg).
Available BAFs in Table 5-1 validate some of the above insights. For example, in comparing BAFs for PFOA with PFOS across all species, it is clear that the BAFs for PFOA are much lower than PFOS. Moreover, comprehensive reviews (Ahrens and Bundshuh 2014; Houde et al. 2008) indicate that PFOS (8-carbon chain PFSA) is typically the most common PFAS observed in fish, as well as air-breathing animals, although in invertebrates, PFOA and PFOS can exhibit similar concentrations (~1–10 ug/kg). Ahrens and Bundshuh (2014) attributed the lower bioaccumulation of PFOA than PFOS to shorter chain (7 perfluorinated carbons in PFOA vs. 8 perfluorinated carbons in PFOS). Overall, the data in Table 5-1 indicate that for perfluorocarboxylates, BAFs increase until 11 or 12 perfluorinated carbons and decline for larger compounds.
Finally, it is important to note that PFAS precursors may contribute to the PFAS body burden. Asher et al. (2012) and Langberg et al. (2020) provided field data indicating an important contribution from precursors to PFOS concentrations in organisms via internal transformation. In addition, atmospheric measurements have shown the widespread occurrence of PFAS precursors like FTOHs and perfluorinated sulfonamide alcohols. Once absorbed by an organism, the precursor(s) may be metabolized to PFOA (for example, from 8:2 fluorotelomer alcohol) or to PFOS (for example, from N-ethyl perfluorooctane sulfonamidoethanol) (Gebbink, Berger, and Cousins 2015; Galatius et al. 2013). Additional research on how PFAS precursors may contribute their bioaccumulation in fish and wildlife is needed.
5.5.3 Biomagnification
Biomagnification factors may be used in the regulatory determination of whether contaminants biomagnify up the food chain and in food web modeling in risk assessments. Key conclusions from published literature are summarized in this section.
Studies of PFAS in the Great Lakes and marine/arctic ecosystems have generally shown that there can be trophic-level biomagnification within a food web, particularly for PFOS and some long-chain PFCAs (Martin et al. 2004; Houde et al. 2006; Houde et al. 2011; Butt et al. 2010; Tomy et al. 2004, 2009).
Martin et al. (2010) estimated BMFs for a pelagic food web in Lake Ontario, with the lake trout as the top predator. They were able to show, after adjusting for benthic versus pelagic organisms, that some PFAS compounds biomagnify, with TMFs ranging from 0.51 for FOSA to 5.88 for PFOS.
A study by Houde et al. (2006) looked at PFOS and C8–C14 perfluorinated carboxylates in the bottlenose dolphin at two marine sites (Sarasota Bay, FL, and Charleston, SC). Based on estimated TMFs, those authors concluded that PFOS and C8–C11 PFCAs biomagnified in this marine food web (Table 5-1, also cited by (Franklin 2016)). Interestingly, for PFCAs, PFOA had the highest TMF, with values progressively decreasing as chain length increased. Conder et al. (2008) reported similar results for perfluorinated acids, with BMF values ranging from 0.1 to 20 (geometric mean of 2). They concluded and Lescord et al. (2015) affirmed that PFCAs with less than seven carbons, and PFSAs with less than six carbons, do not biomagnify and that the bioaccumulation of PFCAs can be directly related to fluorinated carbon chain length (just as the bioaccumulation of persistent lipophilic compounds can be related to hydrophobicity). Conder et al. (2008) also noted that the biomagnification of PFCAs in aquatic food webs is lower than that of most persistent lipophilic compounds, with PFOS being the only perfluorinated acid consistently exhibiting the potential for biomagnification. Finally, Butt et al. (2008) observed biomagnification factors for PFAS in “ringed seal–polar bear” food webs of the Canadian Arctic. Biomagnification factors were greater than one for C8–C14 PFCAs, as well as for PFOS and PFOSA. Like Houde et al. (2006), they observed a decrease in BMF as the carbon chain number increased.
Contrary to other freshwater studies, Lescord et al. (2015) did not find evidence for biomagnification in total PFAS, total PFCA, total PFSA, and PFOS. These authors observed negative relationships between trophic level, as measured using stable nitrogen isotope ratios (δ15N), and concentrations of the studied PFAS compounds (PFOS, total PFCA, total PFSA, and total PFAS) in several of the six lakes, suggesting no biomagnification in these freshwater arctic food webs. Overall, their results suggested that a taxon’s horizontal but not vertical position in the food web affects its PFAS concentrations.
Because the BMF or TMF is the concentration in a predator divided by the concentration in its prey, calculated BMFs can be highly variable depending on what types of tissues were analyzed and what assumptions the researcher made in defining biomagnification relative to the animals’ prey diet (often determined through analysis of stomach contents). Franklin (2016) analyzed the results of 24 peer-reviewed studies reporting field-derived BMFs or TMFs for 14 PFAS. BMF values ranged over several orders of magnitude, from 0.01 to 373 (including only nonzero values). TMFs varied from 0.1 to 20 (including only nonzero values). Franklin (2016) attributed this variability to several factors, including differing ways in which the metrics are expressed (for example, individual tissue analyses versus whole body), nonachievement of the assumed steady-state conditions, uncertainties in feeding ecology, and the metabolism of precursor compounds.
5.5.4 Characterization of Bioaccumulation in Criteria Development and Risk Assessments
In regulatory contexts, BMFs may be used to determine whether or not contaminants are considered bioaccumulative: a BMF greater than 1 indicates that a contaminant is bioaccumulative. The relationship between the BAF and BCF also provides relevant evidence.
Because consensus has not been reached regarding the extent of bioaccumulation and/or biomagnification of some PFAS, most importantly PFOS, the best approach to determining bioaccumulative status of PFAS and to conducting risk assessments is an active subject of discussion (Franklin 2016; Conder et al. 2020). Franklin (2016) made the case that “in practice, the study-to-study (and even within-study) variability of the results is so great that [field-measured BMFs and TMFs] are of very restricted usefulness for assessing bioaccumulation potential status.” Franklin (2016) proposed basing the bioaccumulative status of a compound only on laboratory BCFs and on measurements of BMFs conducted under strictly monitored conditions, rather than relying on field-measured BMFs or TMFs. For fish, studies can make use of the OECD 305 protocol (OECD 2012). For terrestrial and avian species, dietary BMF determinations can be performed using laboratory rodents or cows or pigs fed with naturally contaminated feed, as well as avian species.
Similarly, Conder et al. (2020) proposed using laboratory-derived BCFs instead of field-based BAFs in ecological risk assessments, because lab-based BCFs may be less variable and generally more reliable than field-based BAFs. Moreover, lab-based BCFs are expected to provide conservative estimates of bioaccumulation, as PFAS may be more available in freshly spiked environmental media compared to aged PFAS in field samples. Furthermore, Conder et al. (2020) argued that laboratory BCFs avoid complications with the presence of PFAS precursors, which may transform into stable PFAS in field samples.
However, laboratory BCFs (studies in which organisms are exposed to contaminant in the water only) are subject to methodological limitations—for example, for substances that are highly sorptive. Furthermore, laboratory BCFs do not account for biomagnification, and for this reason will tend to provide low estimates of true BAFs. An approach similar to that proposed by Franklin (2016), namely, combining laboratory-measured BCFs with BMFs measured under controlled conditions, may be reasonable.
Furthermore, while avoiding the complications of precursors, laboratory BCFs also do not account for the contributions of precursors to tissue concentrations of PFOS. PFOS BAFs measured by Langberg et al. (2020) were the highest in Table 5-1, ranging up to about 250,000 L/kg wet weight muscle for PFOS in yellow perch. This value far exceeds values that have been measured in other sites, generally in the range of 1,000–10,000 (Table 5-1). This high value was attributed to the primary role of precursors in determining organisms’ tissue concentrations of PFOS at this site. In an ecological risk assessment for such a site, a tissue concentration determined using measured water column PFOS concentrations and a laboratory-derived BCF (on average, on the order of approximately 1,000 L/kg wet weight whole body for PFOS) would significantly underestimate the true tissue concentration. Thus, if tissue concentrations are primarily determined by precursor levels in the system, then measurement of the substance in water is not appropriate in the first place. Rather, the organism exposure to the precursor(s) itself needs to be measured.
Gobas, Kelly, and Kim (2020) proposed that the bioaccumulative nature of compounds can best be evaluated by focusing on the BMF as measured using dietary-based OECD 305 studies (OECD 2012) , interpreted using a two-compartment bioaccumulation model to estimate the BCF and the BAF. The domain of applicability of the model developed by Gobas, Kelly, and Kim (2020) was limited to nonionic organic chemicals, and so would have to be modified for application to PFAS.
Bioaccumulation rates may differ between linear and branched isomers of PFAS (Conder et al. 2020), and it is hypothesized that linear PFAS are more bioaccumulative than branched PFAS (Houde et al. 2008, 2011). The use of more bioaccumulative isomers in laboratory BCF studies would result in a conservative, but potentially unrealistic, risk assessment for a field population exposed to a mixture of isomers. A full evaluation of the impact of isomer composition will require evaluation of the extent to which differences in bioaccumulation are significant, as well as the relative abundances of isomers in the environment.
Thus, in determining bioaccumulative status and in conducting risk assessments, the variability of field-measured BAFs and BMFs must be balanced against the biases and limitations associated with laboratory BCFs and BMFs. Such evaluations must be performed on a compound-specific basis, taking into account the confounding role of precursors. It is likely that a weight of evidence approach will be called for, given the uncertainties associated with PFAS bioaccumulation.
5.6 PFAS Uptake into Plants
Because PFAS contain a hydrophilic functional group, plants can be expected to take some of these compounds up through their root systems, after which they would be translocated to stems, shoots, leaves, and fruiting bodies. Plants growing closer to contaminated sources or irrigated with PFAS-containing water would be expected to accumulate higher concentrations of PFAS compared to plants more distant from the PFAS source (Gobelius, Lewis, and Ahrens 2017), subject to site-specific conditions such as soil properties. It has already been documented that the land application of biosolids may contaminate soil with PFAS and that animals fed silage from land-applied fields can have elevated concentrations of PFAS in their tissues (Lindstrom et al. 2011; Skutlarek, Exner, and Farber 2006). The Priority Topics for Biosolids Land Application include information about plant uptake (see Section 1.7.4) and uptake by animals (see Section 1.7.5).
This also raises concerns about contamination of wildlife consuming plants from agricultural areas. Airborne PFAS emissions from industrial sites in China were found to impact the concentration of PFAS in bark and tree leaves, with the theory that bioconcentration in the latter may occur through the stomata (Shan et al. 2014).
Understanding uptake of PFAS into plants is critical in evaluating the fate of PFAS among various environmental compartments, particularly along the food chains with implications for human and ecological exposures to PFAS. Human exposure may occur via consumption of PFAS-impacted produce and dairy and meat products from animals fed with PFAS-impacted plant-based feed. Potential wildlife exposure to PFAS may occur via PFAS taken up in plants at impacted sites and releases.
The following sections provide an overview of PFAS uptake pathways and mechanisms in plants and bioconcentration/bioaccumulation.
5.6.1 Uptake Pathways
Wang et al. (2020) provides an extensive review of uptake and accumulation of PFAS in plants. That study forms the basis of the overview provided in this section. As described in Wang et al. (2020), uptake of PFAS has been well documented in different native and planted species to varying degrees. The majority of these studies have focused on PFOA and/or PFOS uptake by agricultural crops, although there are many other PFAS that have been shown to be subject to plant uptake. Wang et al. (2020) also reported that while most published studies were conducted under controlled lab conditions, at least 16 field studies were identified. These field studies typically have focused on point sources of PFAS, including manufacturing sites, fire training areas, wastewater treatment plants, or landfills.
PFAS may be introduced to plants from soil, water, or air by:
- irrigation with impacted water
- land application of biosolids
- leachates from landfills
- impacts or releases at PFAS sites
- emissions and atmospheric deposition
Plant uptake is both PFAS- and soil-specific. PFAS with higher aqueous solubilities/diffusivities with less soil/air-water interface (AWI) retention affinity are often observed with greater uptake potential (bioavailability). For example, Wang et al. (2020) compiled bioconcentration factors (BCFs) for different PFAS that had been reported in literature studies; the bioconcentration factor is the ratio of the PFAS concentration in the plant tissue to the concentration in the soil. This compilation showed the median BCF values for PFBA and other short-chain PFAS were generally more than an order of magnitude greater than the values for long-chain PFAS like PFOA and PFOS. These patterns confirm that the physical-chemical properties of PFAS influence the extent of plant uptake. Likewise, physical-chemical soil properties (for example, organic matter content and composition, pH, salinity, temperature) affect plant uptake of PFAS, although this has not been comprehensively studied. Also, plant species and physiology (for example, transpiration rate and protein content) are important factors as discussed below.
PFAS accumulation in plants occurs primarily via root uptake from soil and water (Stahl et al. 2009; Lee et al. 2014; Wen et al. 2013; Zhang et al. 2019). Aerial uptake of PFAS from the ambient environment (vapor-phase and particle-bound) have also been reported, such as into leaves and bark (Stahl et al. 2014; Jin et al. 2018; Tian et al. 2018; Liu et al. 2019). However, aerial uptake contributes minimally to overall PFAS accumulation in plants (Wang et al. 2020).
As noted above, availability of PFAS in soil porewater for root uptake is largely dependent on the aqueous solubility of specific PFAS (see Section 4) and controlled by interactions with the soil phases and the AWI (see Section 5.2.3 ). PFAS in soil porewater migrates toward plant roots by transpiration and diffusion resulting from a local concentration gradient (Lechner and Knapp 2011). Recent studies by Zhang et al. (2019) and Wen et al. (2013) indicate a concentration-dependent process in root uptake that is mediated by transport proteins in cell membranes such as aquaporins and anion channels. PFAS enter the vascular tissue after passing through the root epidermis, cortex, and endodermis via apoplastic and symplastic pathways (Blaine et al. 2013).
Once in the root xylem, PFAS are translocated to different parts of a plant, such as stem, shoots, leaves, fruits, and grains. The degree of PFAS translocation in these tissues appears to depend on the transpiration stream, with more PFAS accumulation occurring in parts with greater capacity for sorption or incorporation and receiving greater amounts of water (Krippner et al. 2015; Lechner and Knapp 2011; Gobelius, Lewis, and Ahrens 2017; Stahl et al. 2009). For example, in carrots, cucumbers, and potatoes grown in soil mixed with PFAS-contaminated sewage sludge, Lechner and Knapp (2011) found less PFOA and PFOS accumulation in peeled edible parts than in foliage, leaves and stalks., Stahl et al. (2009) found much higher PFOA and PFOS in grains than in straw of spring wheat, oat, and maize. In trees, Gobelius, Lewis, and Ahrens (2017) evaluated the distribution of PFAS at an AFFF release site and reported that total PFAS accumulation followed leaves > twigs > trunk/core or roots in birch and spruce.
5.6.2 Bioconcentration/Bioaccumulation
Table 5-2 (provided as a separate Excel file) contains BCF and BAF values for 14 different PFAS for a variety of plant species. In the cited plant uptake studies, BCF and BAF are defined as PFAS concentration in plant (mass/mass) divided by PFAS concentration in soil (mass/mass) and are used interchangeably. This differs from the definition of BCF and BAF for animals in Section 5.5. A number of BAF values were obtained from studies in which PFAS was introduced to crops through irrigation water or biosolids-amended soils (Blaine et al. 2013, 2014, 2014). The materials harvested for analysis included both inedible (for example, plant leaves) and edible portions of crops (fruit, lettuce leaves, and roots). Other BCFs and BAFs were obtained from investigations of plants exposed to PFAS from soil, groundwater, surface water, or air in close proximity to PFAS release sites (Mudumbi et al. 2014; Zhang et al. 2015; Gobelius, Lewis, and Ahrens 2017). In general, it can be observed that 1) the shorter chain (more water soluble) PFAS are taken up more readily than the longer chain homologues, and 2) the majority of the plant BCFs and BAFs fall between a range of 0.1 and 10. A BCF or BAF of 1.0 indicates no net accumulation of PFAS from soil to plant. Such a BCF or BAF indicates that the soils and the plant of interest have the same concentration of PFAS per unit weight. This, however, does not indicate that an equilibrium condition exists between soils and plants. Some plants, like lettuce, contain a large percentage of water, which may help to explain the relatively high BAF of 56.8 observed by Blaine et al. (2013). In the controlled studies of edible crops, short-chain PFCAs and PFSAs exhibited greater BAFs compared to long-chain compounds.
Blaine et al. (2013) studied the uptake of PFAAs by greenhouse lettuce and tomato grown in soils prepared to mimic an industrially impacted biosolids-amended soil, a municipal biosolids-amended soil, and a control soil (but incorporated contaminated biosolids equivalent to 10 times higher than the agronomic rates allowed for Class B biosolids), a municipal biosolids-amended soil, and a control soil. BCFs for many PFAAs were well above unity, with PFBA having the highest BCF in lettuce (56.8) and PFPeA the highest in tomato (17.1) in the industrially impacted biosolids-amended soil. BAFs for PFCAs and PFSAs were, in general, slightly higher in the industrially impacted soil than in the municipal soil (∼0.3−0.8 log units). The BCFs for PFAAs in greenhouse lettuce decreased approximately 0.3 log units per -CF2 group (one carbon, two fluorine groups in a molecule). They also conducted a limited field study, in which they measured PFAA levels in lettuce and tomato grown in field soil amended with only a single application of biosolids (at the agronomic rate for nitrogen). The PFAA levels were predominantly below the limit of quantitation (LOQ). In addition, corn stover, corn grains, and soil were collected from several full-scale biosolids-amended farm fields. At these fields, all PFAAs were below the LOQ in the corn grains and only trace amounts of PFBA and PFPeA were detected in the corn stover. The Blaine et al. (2013) study confirms that the bioconcentration of PFAAs from biosolids-amended soils depends strongly on PFAA concentrations, soil properties, type of crop, and analyte. BCFs developed in Blaine et al. (2013) can be seen in Table 5-2.
Ghisi, Vamerali, and Manzetti (2019) provided a review of PFAS uptake in agricultural plants, including the potential for uptake from groundwater, soil, and air. Factors contributing to plant uptake include PFAS chain length, functional group, plant species, growth media, soil organic matter, and other soil properties. In general, higher PFAS concentrations in soil are correlated with higher PFAS concentrations in plants; however, the increase in concentrations may not be directly proportional. Short-chain compounds tend to accumulate at higher concentrations in leafy vegetables and fruits, whereas long-chain compounds tend to accumulate more in roots. Several studies have found that PFCAs accumulate at higher rates than PFSAs. Soil organic matter has been found to sequester PFAS and limit plant uptake in some studies reviewed. Another review of bioaccumulation factors for agricultural plants is Lesmeister et al. (2021).
Gobelius, Lewis, and Ahrens (2017) studied the uptake of 26 PFAS in plants (trees) at an AFFF (fire training) site with contaminated soil and groundwater. Samples from groundwater and different plant species (birch, spruce, cherry, ash, elder, beechfern, and wild strawberry) and tissues (that is, roots, trunk/cores, twigs, leaves/needles) were collected. Foliage had the highest BCFs of all tissues, ranging from 0 to 14,000 and accumulated the highest number ofPFAS (8 out of 26), with birch sap showing BCF values up to 41 for 6:2 FTSA. The highest mean BCFs were found for 6:2 FTSA (472; n = 52), PFOS (28; n = 36), PFHxS (10; n = 42), and PFOA (5; n = 24), which might correspond to the AFFF composition used at the site. For PFOA, the mean BCFs (±s.d.) were 18 ± 15 for spruce, followed by birch (1.2 ± 1.5) and cherry (0.25 ± 0.043). The authors concluded that PFAS were detected in all plant species, and the distribution followed the order of “shoots to roots”—that is, leaves > twigs/stems > trunk > roots. They cited other authors who have shown that “this order has proven applicable to all samples and species.” Hence, PFAS tend to accumulate in the vegetative portions rather than in the plant storage tissues.
–
Updated January 2026.

